Customize Hover Labels
When you hover over a visual element in a graph, usually you see a basic description of the data point in a hover label. You can customize what appears in the hover label as follows:
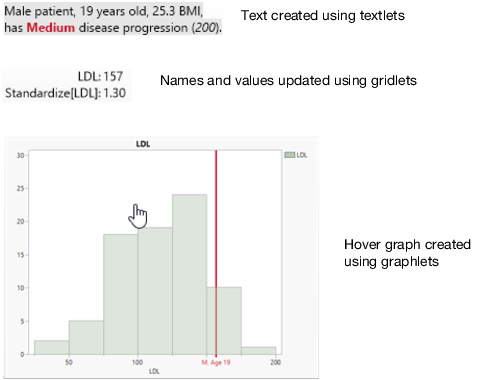
• Add interactive graphs or images using graphlets.
See Add Graphs or Images to Hover Labels.
• Add formatted text using textlets.
See Add Rich Text to Hover Labels.
• Add, remove, or update names and values using gridlets.
See Update Hover Label Grid Entries.
• Learn more about using the Hover Label Editor.
See Edit Hover Labels.
• Update names and values in hover labels, or add labels to graphs.
See Add Images from Data Tables to Hover Labels.
• Add images from data tables.
See Add Images from Data Tables to Hover Labels.
• Pin hover labels on graphs.
See Pin Hover Labels on a Graph.
Figure 9.40 Examples of Graphs, Text, Names, and Values in Hover Labels