Publication date: 07/30/2020
Cell Plots
View Color-Intensity Plots of Variables
Using cell plots, you can visualize each cell in a data table. Cell plots are direct representations of a data table, since they draw a rectangular array of cells where each cell corresponds to a data table entry. Cell plots were popularized by genomics applications to browse large numbers of values for gene expression levels.
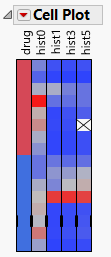
Figure 8.1 Example of a Cell Plot
Contents
Example of a Cell Plot
Launch the Cell Plot Platform
The Cell Plot
Cell Plot Platform Options
Pop-Up Menu for Cell Plots
Additional Example of the Cell Plot Platform
Want more information? Have questions? Get answers in the JMP User Community (community.jmp.com).