Custom Test
To test one or more custom hypotheses involving any model parameters, select Custom Test from the Estimates menu. In this window, you can specify one or more linear functions, or contrasts, of the model parameters.
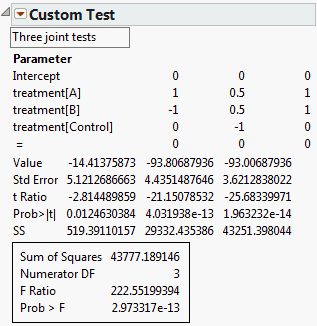
The results include individual tests for each contrast and a joint test for all contrasts. See Figure 3.26. The report for the individual contrasts gives the estimated value of the specified linear function of the parameters and its standard error. A t ratio, its p-value, and the associated sum of squares are also provided. Below the individual contrast results, the joint test for all contrasts gives the sum of squares, the numerator degrees of freedom, the F ratio, and its p-value.
Caution: These tests are conducted using residual error. If you have random effects in your model and if you use EMS instead of REML, then these tests might not be appropriate.
Note: If you are testing for effects that are involved in higher-order effects, consider using a test for least squares means, rather than a custom test. Least squares means are adjusted for other model effects. You can test least squares means contrasts under Effect Details.
Custom Test Report Components
The Custom Test specification window has the following components:
Editable text box
The space beneath the Custom Test title bar is an editable area for entering a test name.
Parameter
Lists the model terms. To the right of the list of terms are columns of zeros corresponding to the corresponding parameters. Enter values in these cells to specify the linear functions for your tests.
The “=” sign
The last line in the Parameter list is labeled =. Enter a constant into this cell to complete the specification for each contrast.
Add Column
Adds columns of zeros so that you can jointly test several linear functions of the parameters.
Done
Click the Done button to perform the tests. The report changes to show the test statistic value, the standard error, and other statistics for each test column. The joint F test for all columns is given in a box at the bottom of the report.
Custom Test Report Options
The Custom Test red triangle menu contains the following options:
Power Analysis
Provides a power analysis for the joint test. This option is available only after the test has been conducted. See Parameter Power.
Remove
Removes the Custom Test report.
Note: Select Estimates > Custom Test repeatedly to conduct several joint custom tests.
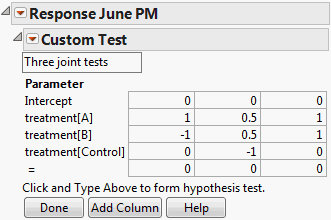
Figure 3.26 shows an example of the specification window with three contrasts, using the Cholesterol.jmp sample data table. Note that the constant is set to zero for all three tests. The report for these tests is shown in Figure 3.27.
Example of a Custom Test
The Cholesterol.jmp sample data table gives repeated measures on 20 patients at six time periods. Four treatment groups are studied. Typically, this data should be properly analyzed using all repeated measures as responses. This example considers only the response for June PM.
Suppose that you want to test three contrasts. You want to compare the mean responses for the following:
• treatment A to treatment B
• treatments A and B to the control group
• treatments A and B to the control and placebo groups
To test these contrasts using Custom Test:
1. Select Help > Sample Data Library and open Cholesterol.jmp.
2. Select Analyze > Fit Model.
3. Select June PM and click Y.
4. Select treatment and click Add.
5. Click Run.
6. Click the red triangle next to Response June PM and select Estimates > Custom Test.
7. In the Custom Test specification window, click Add Column twice to create three columns.
8. Fill in the editable area with a test name and enter values in the three columns as shown in Figure 3.26.
To see how to obtain these values, particularly those in the third column, see Interpretation of Parameters in the Statistical Details section.
Figure 3.26 Custom Test Specification Window for Three Contrasts
9. Click Done.
The results shown in Figure 3.27 indicate that all three hypotheses are individually, as well as jointly, significant.
Figure 3.27 Custom Test Report Showing Tests for Three Contrasts