This version of the Help is no longer updated. See JMP.com/help for the latest version.

.
Fitting Linear Models > Standard Least Squares Report and Options
Publication date: 07/30/2020

Standard Least Squares Report and Options

Analyze Common Classes of Models

The Standard Least Squares personality within the Fit Model platform fits a wide spectrum of standard models. These models include regression, analysis of variance, analysis of covariance, and mixed models, as well as the models typically used to analyze designed experiments. Use the Standard Least Squares personality to construct linear models for continuous-response data using least squares or, in the case of random effects, restricted maximum likelihood (REML).

Analytic results are supported by compelling dynamic visualization tools such as profilers, contour plots, and surface plots (see Profilers). These visual displays stimulate, complement, and support your understanding of the model. They enable you to optimize several responses simultaneously and to explore the effect of noise.

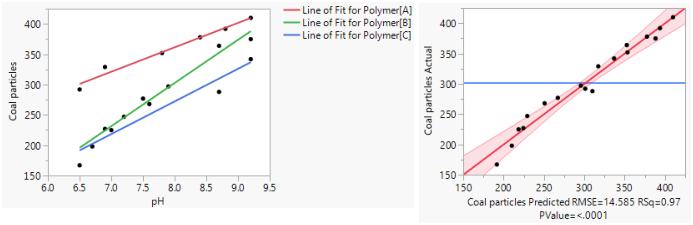
Figure 3.1 Examples of Standard Least Squares PlotsĀ 

Contents

Example Using Standard Least Squares

Launch the Standard Least Squares Personality

Fit Model Launch Window
Standard Least Squares Options in the Fit Model Launch Window
Validation
Missing Values

Fit Least Squares Report

Single versus Multiple Responses
Report Structure Related to Emphasis
Special Reports
Least Squares Fit Options
Fit Group Options

Response Options

Regression Reports

Summary of Fit
Analysis of Variance
Parameter Estimates
Effect Tests
Effect Details
Lack of Fit

Estimates

Show Prediction Expression
Sorted Estimates
Expanded Estimates
Indicator Parameterization Estimates
Sequential Tests
Custom Test
Multiple Comparisons
Compare Slopes
Joint Factor Tests
Inverse Prediction
Cox Mixtures
Parameter Power
Correlation of Estimates
Coding for Nominal Effects

Effect Screening

Scaled Estimates and the Coding of Continuous Terms
Plot Options
Normal Plot Report
Bayes Plot Report
Pareto Plot Report

Factor Profiling

Profiler
Interaction Plots
Contour Profiler
Mixture Profiler
Cube Plots
Box Cox Y Transformation
Surface Profiler

Row Diagnostics

Leverage Plots
Press

Save Columns

Prediction Formula

Effect Summary Report

Mixed and Random Effect Model Reports and Options

Mixed Models and Random Effect Models
Restricted Maximum Likelihood (REML) Method
EMS (Traditional) Model Fit Reports

Models with Linear Dependencies among Model Terms

Singularity Details
Parameter Estimates Report
Effect Tests Report
Examples

Statistical Details for the Standard Least Squares Personality

Emphasis Rules
Details of Custom Test Example
Correlation of Estimates
Leverage Plot Details
The Kackar-Harville Correction
Power Analysis
Want more information? Have questions? Get answers in the JMP User Community (community.jmp.com).