Effect Summary Report
The Effect Summary option shows an interactive report. It gives a plot of the LogWorth (or FDR LogWorth) values for the effects in the model. The report also provides controls that enable you to add or remove effects from the model. The model fit report updates automatically based on the changes made in the Effects Summary report.
The Effect Summary report is available in the following personalities:
• Standard Least Squares
• Nominal Logistic
• Ordinal Logistic
• Proportional Hazard
• Parametric Survival
• Generalized Linear Model
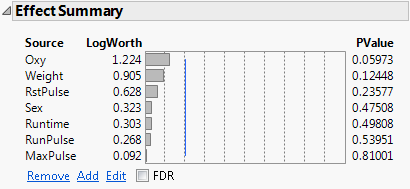
Figure 3.59 shows the initial view of the Effect Summary report for the Fitness.jmp data table. The check box labeled FDR controls the columns that appear in the summary table.
Figure 3.59 Effect Summary Report
Effect Summary Table Columns
The Effect Summary table contains the following columns:
Source
Lists the model effects, sorted by ascending p-values.
LogWorth
Shows the LogWorth for each model effect, defined as -log10(p-value). This transformation adjusts p-values to provide an appropriate scale for graphing. A value that exceeds 2 is significant at the 0.01 level (because −log10(0.01) = 2).
FDR LogWorth
Shows the False Discovery Rate LogWorth for each model effect, defined as -log10(FDR PValue). This is the best statistic for plotting and assessing significance. However, it is highly dependent on the ordering of the significances, is conservative for positively correlated tests, and does not give experimentwise protection at the alpha level. Select the FDR check box to replace the LogWorth column with the FDR LogWorth column.
Bar Graph
Shows a bar graph of the LogWorth (or FDR LogWorth) values. The graph has dashed vertical lines at integer values and a blue reference line at 2.
PValue
Shows the p-value for each model effect. This is generally the p-value corresponding to the significance test displayed in the Effect Tests table or Effect Likelihood Ratio Tests table of the model report.
FDR PValue
Shows the False Discovery Rate p-value for each model effect calculated using the Benjamini-Hochberg technique. This technique adjusts the p-values to control the false discovery rate for multiple tests. Select the FDR check box to replace the PValue column with the FDR PValue column.
For more information about the FDR correction, see Benjamini and Hochberg (1995). For more information about the false discovery rate, see The False Discovery Rate in Predictive and Specialized Modeling or Westfall et al. (2011).
Effect Heredity Column
Identifies lower-order effects that are components of more significant higher-order effects. The lower-order effects are identified with a caret. See Effect Heredity.
Effect Summary Table Options
The options below the summary table enable you to add and remove effects:
Remove
Removes the selected effects from the model. To remove one or more effects, select the rows corresponding to the effects and click the Remove button.
Add
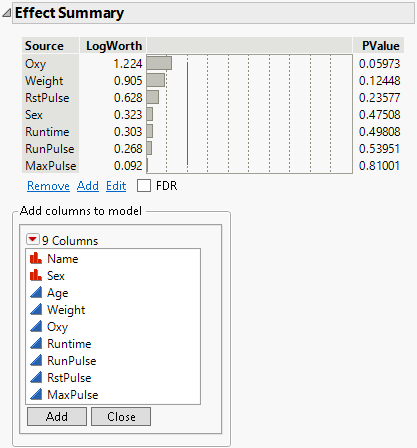
Opens a panel that contains a list of all columns in the data table. Select columns that you want to add to the model, and then click Add below the column selection list to add the columns to the model. Click Close to close the panel. Figure 3.60 shows the Add Columns panel.
Figure 3.60 Effect Summary Add Columns Panel
Edit
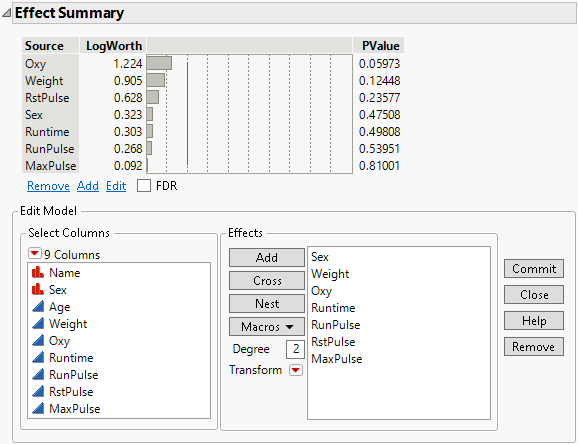
Opens the Edit Model panel, which contains a Select Columns list and an Effects specification panel. The Effects panel resembles the Construct Model Effects panel in the Fit Model launch window. The Edit Model panel enables you to add individual, crossed, nested, and transformed effects. You can also add multiple effects using the Macros menu. For more information about how to construct effects using Add, Cross, Nest, Macros, and Transform, see Construct Model Effects.
The following options are available to the right of the Effects panel:
Commit
applies your updates to the model.
Close
closes the panel without making changes to the model.
Remove
removes one or more selected effects from the Effects list.
Figure 3.61 shows the Edit Model panel.
Tip: The Edit button gives you the greatest degree of control over updates to your model. It includes the functionality of the Remove and Add buttons and enables you to construct effects to add to your model.
Undo
Enables you to undo changes to the effects in the model.
Figure 3.61 Effect Summary Edit Model Panel
Effect Heredity
When a model contains significant higher-order effects, you might want to retain some or all of their lower-order components, even though these are not significant. The principle of strong effect heredity states that, if a higher-order effect is included in the model, all of its lower-order components should be included as well. The principle of weak effect heredity indicates that a chain of components should be included.
When a lower-order component of a higher-order effect appears in the Effect Summary table below the higher-order effect, a caret appears in the right-most column. The caret indicates that the containing higher-order effect is more significant than the lower-order effect. If all higher-order effects that contain a lower-order effect are less significant than the lower-order effect, no caret appears in the row for the lower-order effect.
If you remove an effect marked with a caret, you can choose one of two approaches for removing effects. Choose Remove all selected effects to remove all the selected effects, including the ones marked with a caret. Choose Remove only non-contained effects to remove only the selected effects that do not have a higher-order effect that still remains in the model.
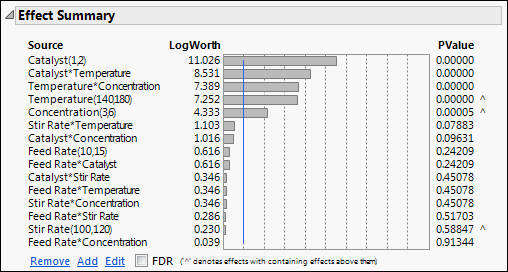
Figure 3.62 show an example of an Effect Summary table where three lower-order effects appear below higher-order effects that contain the lower-order effects. For example, Stir Rate(100,120) appears below Stir Rate*Temperature.
Figure 3.62 Effect Summary Table with Effect Heredity for Reactor 32 Runs.jmp
Multiple Responses
In the case of multiple responses, each effect appears in each response model, but only one Effect Summary report appears. For each effect, the table shows the minimum p-value among the p-values for that effect. Adding or removing an effect applies to the models for all of the responses.