Publication date: 07/30/2020
Surface Profiler
Note: For more information about the surface profiler, see Surface Plot in Profilers.
The Surface Profiler shows a three-dimensional surface plot of the response surface.
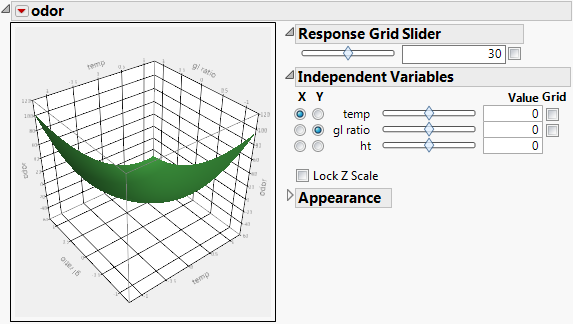
Figure 3.55 shows the Surface Profiler for the model in the Odor.jmp sample data table. Run the Model data table script and then select Factor Profiling > Surface Profiler from the report’s red triangle menu. You can change the variables on the axes using the radio buttons under Independent Variables. Also, you can plot points by clicking Actual under Appearance.
Figure 3.55 Surface Plot
Want more information? Have questions? Get answers in the JMP User Community (community.jmp.com).