Plot Options
The Normal, Bayes, and Pareto Plot options provide reports that appear as part of the Effect Screening report. These reports can be constructed so that they correct for unequal variances and correlations among the estimates.
Note: The Normal, Bayes, and Pareto Plot options require that your model involves at least four parameters. One of these parameters can be the intercept.
Transformations
When you select any of the plot options, the following information appears directly beneath the Effect Screening report title:
• If the estimates have equal variances and are uncorrelated, these two notes appear:
– The parameter estimates have equal variances.
– The parameter estimates are not correlated.
• If the estimates have unequal variances or are correlated, then an option list replaces the relevant note. The list items selected by default show that JMP has transformed the estimates. If you want to undo either or both transformations, select the appropriate list items.
Lenth PSE Values
A Lenth PSE (pseudo standard error) table appears directly beneath the notes or option lists. (For a description of the PSE, see Lenth’s PSE.) The statistics that appear in the Lenth table depend on the variances and correlation of the parameter estimates.
When the parameter estimates have equal variances and are uncorrelated, the Lenth table provides the following statistic:
Lenth PSE
The Lenth pseudo standard error for the estimates.
When the parameter estimates have unequal variances or are correlated or both, the Lenth table provides the following statistics:
t-Test Scale Lenth PSE
The Lenth pseudo standard error computed for the transformed parameter estimates divided by their standard errors in the transformed scale.
Coded Scale Lenth PSE
The Lenth pseudo standard error for the transformed parameter estimates.
Parameter Estimate Population Report
The Parameter Estimate Population report gives tests for the parameter estimates. The tests are based on transformations as specified in the option lists.
• The option Using estimates standardized to have equal variances applies a normalizing transformation to standardize the variances. This option is selected by default when the variances are unequal.
• The option Using estimates orthogonalized to be uncorrelated applies a transformation to remove correlation. This option is selected by default when the estimates are correlated. The transformation that is applied is identical to the transformation that is used to calculate sequential sums of squares. The estimates measure the additional contribution of the variable after all previous variables have been entered into the model.
• If the notes indicate that the estimates have equal variances and are not correlated, no transformation is applied.
The columns that appear in the table depend on the selections initially described in the notes or option lists. The report highlights any row corresponding to an estimate with a p-value of 0.20 or less. All versions of the report give Term, Estimate, and either t-Ratio and Prob>|t| or Pseudo t-Ratio and Pseudo p-Value.
Term
Gives the model term whose parameter estimate is of interest.
Estimate
Gives the estimate for the parameter. Estimate sizes can be compared only when the model effects have identical scaling.
t-Ratio
Appears if there are degrees of freedom for error. This value is the parameter estimate divided by its standard error.
Prob>|t|
Gives the p-value for the test. If a transformation is applied, this option gives the p-value for a test using the transformed data.
Pseudo t-Ratio
Appears when there are no degrees of freedom for error. If the relative standard errors of the parameters are equal, Pseudo t-Ratio is the parameter estimate divided by Lenth’s PSE. If the relative standard errors vary, it is calculated as shown in Pseudo t-Ratios.
Pseudo p-Value
Appears when there are no degrees of freedom for error. The p-value is derived using a t distribution. The degrees of freedom are m/3, rounded down to the nearest integer, where m is the number of parameters.
If Using estimates standardized to have equal variances is selected and the note indicating that the parameter estimates are not correlated appears, the report shows a column called Standardized Estimate. This column provides estimates of the parameters resulting from the transformation used to transform the estimates to have equal variances.
If both Using estimates standardized to have equal variances and Using estimates orthogonalized to be uncorrelated are selected, the report gives a column called Orthog Coded. The following information is provided:
Orthog Coded
Gives the estimate of the parameter resulting from the transformation that is used to orthogonalize the estimates.
Orthog t-Ratio
Appears if there are degrees of freedom for error. Gives the t ratio for the transformed estimates.
Pseudo Orthog t-Ratio
Appears if there are no degrees of freedom for error. It is a t ratio computed by dividing the orthogonalized estimate, Orthog Coded, by Coded Scale Lenth PSE.
Effect Screening Report
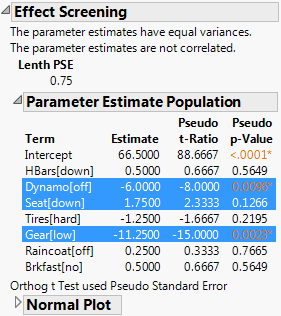
Figure 3.43 shows the Effect Screening report that you create by running the Fit Model script in the Bicycle.jmp sample data table. Note that you would select Effect Screening > Normal Plot in order to obtain this form of the report. The notes directly beneath the report title indicate that no transformation is required. Consequently, the Lenth PSE is displayed. Because there are no degrees of freedom for error, no estimate of residual error can be constructed. For this reason, Lenth’s PSE is used as an estimate of residual error to obtain pseudo t ratios. Pseudo p-values are given for these t ratios. Rows for non-intercept terms corresponding to the three estimates with p-values of 0.20 or less are highlighted.
Figure 3.43 Effect Screening Report for Equal Variance and Uncorrelated Estimates
Effect Screening Report for Unequal Variances and Correlated Estimates
In the Odor.jmp sample data table, run the Model script and click Run. To create the report shown in Figure 3.44, click the Response Y red triangle and select Effect Screening > Normal Plot. You can also create the report by clicking the Response Y red triangle and selecting the Bayes Plot or Pareto Plot options.
The notes directly beneath the report title indicate that transformations were required both to standardize and orthogonalize the estimates. The correlation matrix is shown in the Correlation of Estimates report.
The report shows the t-Test Scale and Coded Scale Lenth PSEs. But, because there are degrees of freedom for error, the tests in the Parameter Estimate Population report do not use the Lenth PSEs. Rows for non-intercept terms corresponding to the three estimates with p-values of 0.20 or less are highlighted. A note at the bottom of the Parameter Estimate Population report indicates that orthogonalized estimates depend on their order of entry into the model.
Figure 3.44 Effect Screening Report for Unequal Variances and Correlated Estimates
Correlations of Estimates Report
The Correlations of Estimates report appears only if the estimates are correlated (Figure 3.44). The report provides the correlation matrix for the parameter estimates. This matrix is similar to the one that you obtain by selecting the Estimates > Correlation of Estimates red triangle option. However, to provide a more compact representation, the report does not show column headings. See Correlation of Estimates.
“Transformation to make uncorrelated” Report
The “Transformation to make uncorrelated” report appears only if the estimates are correlated. The report gives the matrix used to transform the design matrix to produce uncorrelated parameter estimates. The transformed, or orthogonally coded, estimates are obtained by pre-multiplying the original estimates with this matrix and multiplying the result by a scale factor. The scale factor is a function of the root mean square error (RMSE) and the number of rows. It is defined as follows:
RMSE / sqrt( NRows )
The transformation matrix can be obtained using the Cholesky decomposition. Express X′X as LL′, where L is the lower triangular matrix in the Cholesky decomposition. Then the transformation matrix is given by L′.
This transformation orthonormalizes each regressor with respect to the regressors that precede it in the ordering of model terms. The transformation produces a diagonal covariance matrix with equal diagonal elements. The coded estimates are a result of this iterative process.
Note: The orthogonally coded estimates depend on the order of terms in the model. Each effect’s contribution is estimated only after it is made orthogonal to previously entered effects. Consider entering main effects first, followed by two-way interactions, then three-way interactions, and so on.