Element Types and Options
When you enter variables into zones, element types that are not applicable are not available and appear dimmed. You can change how your data appear by clicking on an element type icon.
Figure 3.22 Element Type Icons
![]()
You can specify and change properties for each element type in the Properties area under the Variables panel. For every element type that you apply in a graph, an outline whose name is the element type appears in the Properties area.
Figure 3.23 Example of the Properties Areas for Points and Smoother
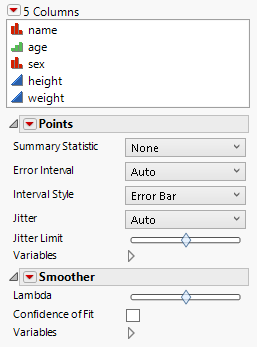
You can also right-click in any graph to change the element, or customize elements in the graph.
Select Multiple Elements at Once
To select and overlay multiple elements, press Shift and click the elements. Alternatively, you can drag the elements into the graph one at a time.
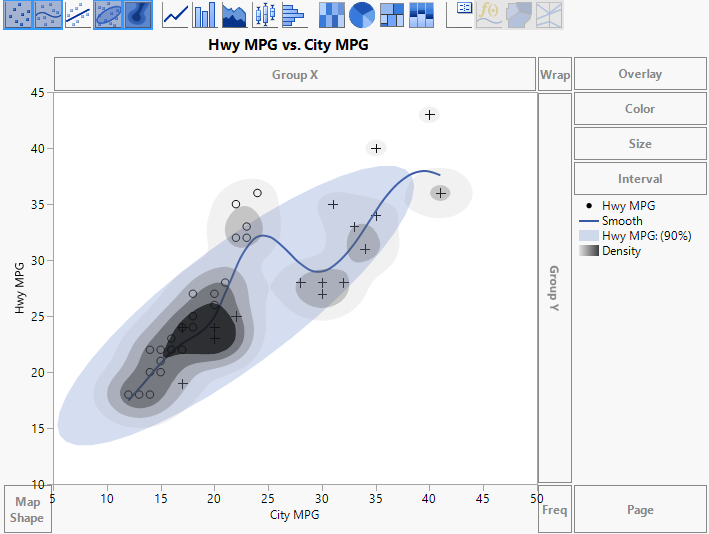
Figure 3.24 Graph Showing Points, Smoother, Ellipse, and Contour Elements
Labels for Points
In most graphs that display points, when you place your cursor over a point, a label appears showing information about the corresponding row. Place your cursor over the label and right-click for more options. You can pin the label to the graph, copy the contents, or close to remove the label. You can also pin the label by clicking the pin icon in the upper right of the label. See Pin Hover Labels on a Graph in Using JMP.
Hidden but Unexcluded Rows
As a general rule, when you hide rows but do not exclude them, elements in the plot that are in one-to-one correspondence with the hidden rows are then hidden in the plot. When elements in the plot are not in one-to-one correspondence with rows that are hidden but not excluded, the effect on the plot depends on the element type. For more information about a graph element, see the specific element’s section.
The following example illustrates how plot elements that are not in one-to-one correspondence with rows might be entirely hidden when one constituent row is hidden.
1. Select Help > Sample Data Library and open Big Class.jmp.
2. Select Graph > Graph Builder.
3. Select age and drag it to the X zone.
4. Go back to Big Class.jmp, right-click row 8, and select Hide/Unhide.
In Graph Builder, the corresponding point disappears.
5. In Big Class.jmp, select Rows > Clear Row States.
6. In Graph Builder, click and drag the Bar icon ![]() into the plot.
into the plot.
7. In Big Class.jmp, right-click row 8, and select Hide/Unhide.
In Graph Builder, the entire bar disappears.