Example of a Compound Multivariate Model
JMP can handle data with layers of repeated measures. For example, see the Cholesterol.jmp data table. Groups of five participants belong to one of four treatment groups called A, B, Control, and Placebo. Cholesterol was measured in the morning and again in the afternoon once a month for three months (the data are fictional). In this example, the response columns are arranged chronologically with time of day within month.
1. Select Help > Sample Data Library and open Cholesterol.jmp.
2. Select Analyze > Fit Model.
3. Select April AM, April PM, May AM, May PM, June AM, and June PM and click Y.
4. Select treatment and click Add.
5. Next to Personality, select Manova.
6. Click Run.
Figure 9.10 Treatment Graph
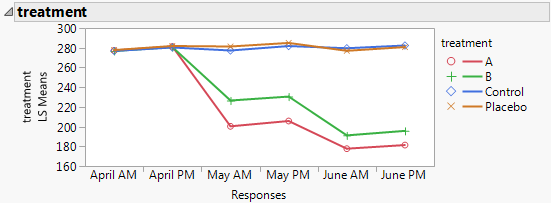
In the treatment graph, you can see that the four treatment groups began the study with very similar mean cholesterol values. The A and B treatment groups appear to have lower cholesterol values at the end of the trial period. The control and placebo groups remain unchanged.
7. Click the Choose Response menu and select Compound.
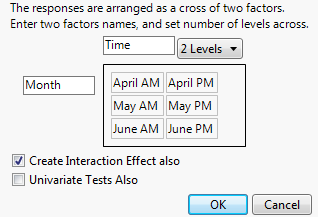
Complete this window to tell JMP how the responses are arranged in the data table and the number of levels of each response. In the cholesterol example, the time of day columns are arranged within month. Therefore, you name time of day as one factor and the month effect as the other factor. Testing the interaction effect is optional.
8. Use the options in Figure 9.11 to complete the window.
Figure 9.11 Compound Window
9. Click OK.
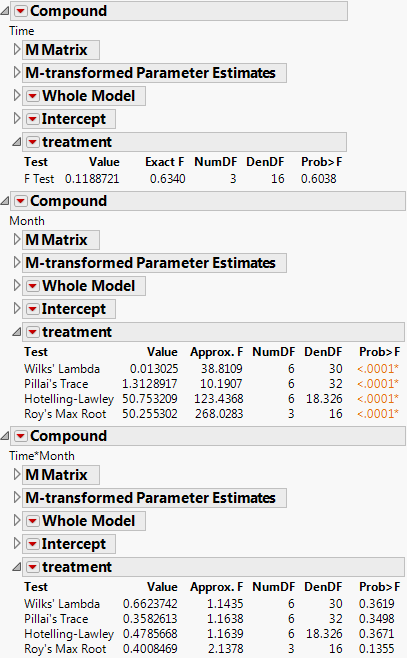
The tests for each effect appear. Parts of the report are shown in Figure 9.12. Note the following:
– The report for Time shows a p-value of 0.6038 for the interaction between Time and treatment, indicating that the interaction is not significant. This means that there is no evidence of a difference in treatment between AM and PM. Since Time has two levels (AM and PM), the exact F test appears.
– The report for Month shows p-values of <.0001 for the interaction between Month and treatment, indicating that the interaction is significant. This suggests that the differences between treatment groups change depending on the month. The treatment graph in Figure 9.10 indicates no difference among the groups in April, but the difference between treatment types (A, B, Control, and Placebo) becomes large in May and even larger in June.
– The report for Time*Month shows no significant p-values for treatment. This indicates that the three-way interaction effect involving Time, Month, and treatment is not statistically significant.
Figure 9.12 Cholesterol Study Results