Example of Analysis of Means for Proportions
This example uses the Office Visits.jmp sample data table, which records late and on-time appointments for six clinics in a geographic region. 60 random appointments were selected from 1 week of records for each of the six clinics. To be considered on-time, the patient must be taken to an exam room within five minutes of their scheduled appointment time. Examine the proportion of patients that arrived on-time to their appointment.
1. Select Help > Sample Data Library and open Office Visits.jmp.
2. Select Analyze > Fit Y by X.
3. Select On Time and click Y, Response.
4. Select Clinic and click X, Factor.
5. Select Frequency and click Freq.
6. Click OK.
7. Click the red triangle next to Contingency Analysis of On Time By Clinic and select Analysis of Means for Proportions.
8. Click the red triangle next to Analysis of Means for Proportions and select Show Summary Report and Switch Response Level for Proportion.
Figure 7.9 Example of Analysis of Means for Proportions
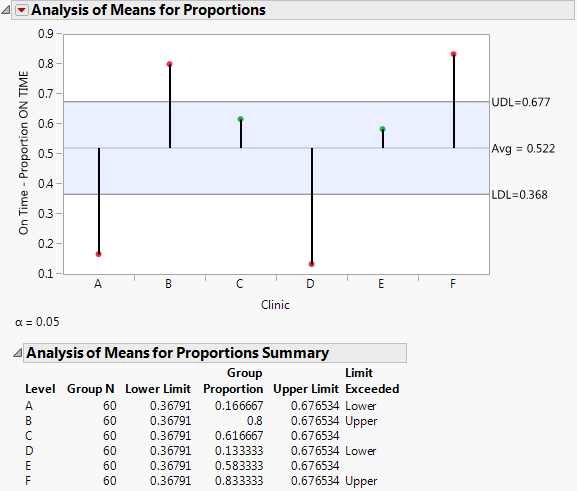
Figure 7.9 shows the proportion of patients who were on-time from each clinic. From Figure 7.9, notice the following:
• The proportion of on-time arrivals is the highest for clinic F, followed by clinic B.
• Clinic D has the lowest proportion of on-time arrivals, followed by clinic A.
• Clinic E and clinic C are close to the average, and do not exceed the decision limits.