Publication date: 07/30/2020
Example of Creating Interactive HTML
Create a Report
1. Select Help > Sample Data Library and open Big Class.jmp.
2. Select Analyze > Distribution.
3. Select height and click Y, Columns.
4. Click OK.
Save as Interactive HTML
1. (Windows) Select File > Export, select Interactive HTML with Data, and then click OK.
1. (MacOS) Select File > Export, select Interactive HTML with Data, and then click Next.
2. On the Export window, select Open the file after saving if it’s not already selected.
3. Name and save the file.
The output appears in your default browser.
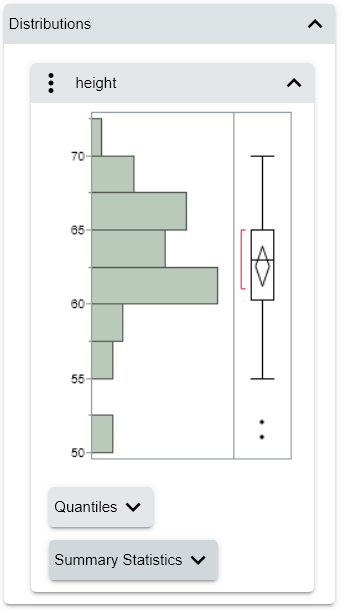
Figure 7.16 Interactive HTML Output
For information about exploring interactive HTML output, visit https://www.jmp.com/interactive.
Want more information? Have questions? Get answers in the JMP User Community (community.jmp.com).