Example of the k Sample Means Calculator
Suppose you have 4 observations from each of 4 groups and you want to test to see whether all of the group means are equal. You expect the group means to be 10, 11, 12, and 13 with a standard deviation of 0.9. Calculate the power of detecting a difference in one or more means at a 0.05 significance level.
1. Select DOE > Design Diagnostics > Sample Size and Power.
2. Click k Sample Means.
3. Leave Alpha as 0.05.
4. Enter 0.9 for Std Dev.
5. Leave Extra Parameters as 0.
6. Enter 10, 11, 12, and 13 as the four levels of prospective means.
7. Enter 16 for Sample Size.
8. Leave Power blank.
9. Click Continue.
Figure 17.9 Prospective Power for 4 Means
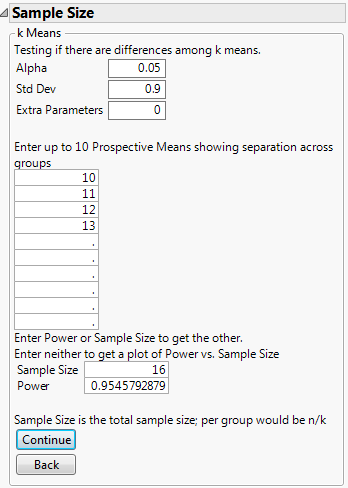
The Power is calculated as approximately 0.95. This means that there is a 95% chance of detecting that at least one of the means is different at a 0.05 significance level, assuming that the population means are 10, 11, 12, and 13, with a standard deviation of 0.9 and a total sample size of 16.
10. Click the 16 for Sample Size and delete it.
11. Click the 0.95 for Power and delete it.
12. Click Continue to launch a plot of power versus sample size.
Figure 17.10 Prospective Power for k Means and Plot of Power by Sample Size
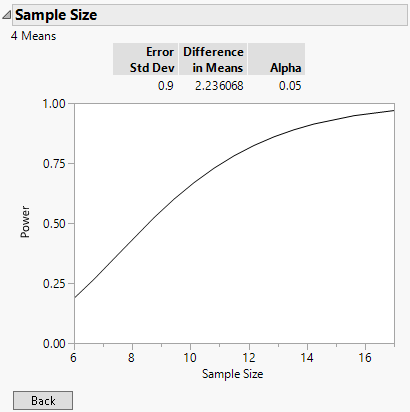
From the plot of power versus sample size, you can confirm that a sample size of 16 is acceptable. Place your cursor on the Sample Size axis and drag to extend the axis beyond 16. You can see that the increase in power for sample sizes above 16 is slight.
The plot also reports the difference in means, which is calculated as the square root of the sum of squared deviations from the grand mean. In this case, it is the square root of (–1.5)2 + (–0.5)2 + (0.5)2 + (1.5)2, which is the square root of 5. Therefore, the difference in means in this example is approximately 2.236.