Example of Variable Importance for One Response
The Boston Housing.jmp sample data table contains data on 13 factors that might relate to median home values. You fit a model using a neural network. Because neural networks do not accommodate formal hypothesis tests, these tests are not available to help assess which variables are important in predicting the response. However, for this purpose, you can use the Assess Variable Importance profiler option.
Note that your results might differ from, but should resemble, those shown here. There are two sources of random variability in this example. When you fit the neural network, k-fold cross validation is used. This partitions the data into training and validation sets at random. Also, Monte Carlo sampling is used to calculate the factor importance indices.
1. Select Help > Sample Data Library and open Boston Housing.jmp.
2. Select Analyze > Predictive Modeling > Neural.
3. Select mvalue from the Select Columns list and click Y, Response.
4. Select all other columns from the Select Columns list and click X, Factor.
5. Click OK.
6. In the Neural Model Launch panel, select KFold from the list under Validation Method.
When you select KFold, the Number of Folds defaults to 5.
7. (Optional) Enter 123 next to Random Seed.
Note: Results vary due to the random nature of choosing a validation set in the Neural Network model. Entering the seed above enables you to reproduce the results shown in this example.
8. Click Go.
9. Click the red triangle next to Model NTanH(3) and select Profiler.
The Prediction Profiler is displayed at the very bottom of the report. Note the order of the factors for later comparison.
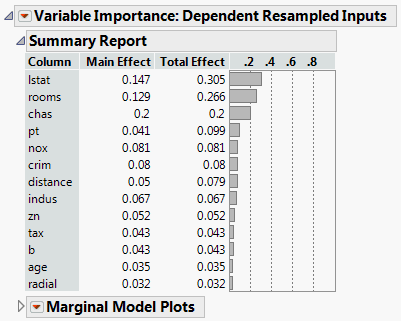
Because the factors are correlated, you take this into account by choosing Dependent Resampled Inputs as the sampling method for assessing variable importance.
10. Click the Prediction Profiler red triangle and select Assess Variable Importance > Dependent Resampled Inputs.
The Variable Importance: Dependent Resampled Inputs report appears. Check that the Prediction Profiler cells have been reordered by the magnitude of the Total Effect indices in the report. In Figure 3.26, check that the Total Effect importance indices identify rooms and lstat as the factors that have most impact on the predicted response.
Figure 3.26 Dependent Resampled Inputs Report
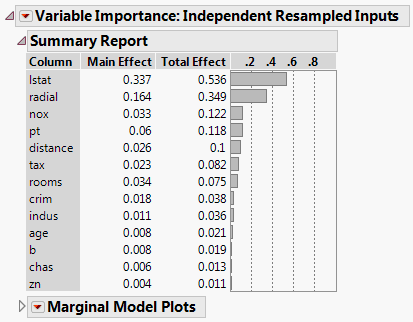
You might be interested in comparing the importance indices obtained assuming that the factors are correlated, with those obtained when the factors are assumed independent.
11. Click the Prediction Profiler red triangle and select Assess Variable Importance > Independent Resampled Inputs.
The resampled inputs option makes sense in this example, because the distributions involved are not uniform. The Variable Importance: Independent Resampled Inputs report is shown in Figure 3.27. Check that the two factors identified as having the most impact on the predicted values are lstat and radial.
Figure 3.27 Independent Resampled Inputs Report