Launch the Tabulate Platform
To launch the Tabulate platform, select Analyze > Tabulate.
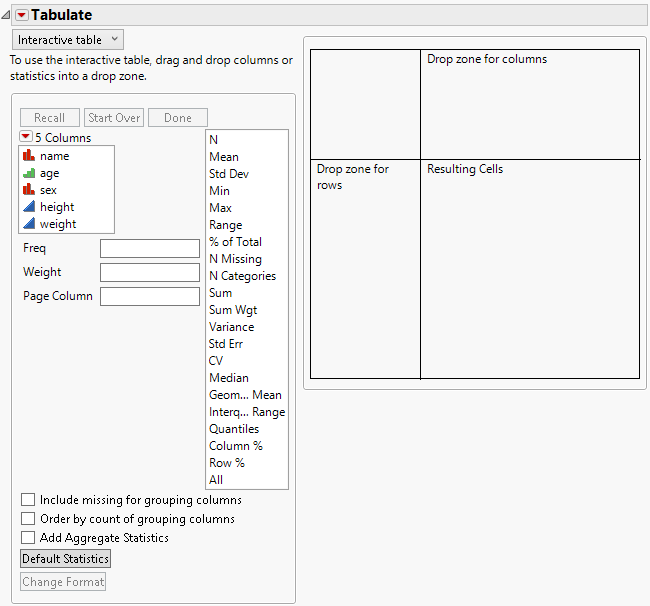
Figure 9.7 The Tabulate Interactive Table
Note: For more information about red triangle options, see Tabulate Platform Options. For more information about the options in the Select Columns red triangle menu, see Column Filter Menu in Using JMP.
The Tabulate window contains the following options:
Interactive table/Dialog
Switch between the two modes. Use the interactive table mode to drag and drop items, creating a custom table. Use the dialog mode to create a simple table using a fixed format. See Use the Dialog.
Statistics options
Lists standard statistics. Drag any statistic from the list to the table to incorporate it. See Add Statistics.
Drop zone for columns
Drag and drop columns or statistics here to create columns.
Note: If the data table contains columns with names equal to those in the Statistics options, be sure to drag and drop the column name from the column list. Otherwise, JMP might substitute the statistic of the same name in the table.
Drop zone for rows
Drag and drop columns or statistics here to create rows.
Tip: You can also select one or more columns in the columns list, select one or more of the statistics, and then Alt-click (Option-click on macOS) on a drop zone to create rows or columns in the table.
Resulting cells
Shows the resulting cells based on the columns or statistics that you drag and drop.
Freq
Identifies the data table column whose values assign a frequency to each row. This option is useful when a frequency is assigned to each row in summarized data.
Weight
Identifies the data table column whose variables assign weight (such as importance or influence) to the data.
Page Column
Generates separate tables for each category of a nominal or ordinal column. See Example Using a Page Column.
Include missing for grouping columns
Creates a separate group for missing values in grouping columns. When unchecked, missing values are not included in the table. Note that any missing value codes that you have defined as column properties are taken into account.
Order by count of grouping columns
Changes the order of the table to be in descending order of the values of the grouping columns.
Add Aggregate Statistics
Adds aggregate statistics for all rows and columns.
Default Statistics
Enables you to change the default statistics that appear when you drag and drop analysis or non-analysis (for example, grouping) columns.
Change Format
Enables you to change the numeric format for displaying specific statistics. See Change Numeric Formats.
Change Plot Scale
(Appears only if Show Chart is selected from the red triangle menu.) Enables you to specify a uniform custom scale.
Uniform plot scale
(Appears only if Show Chart is selected from the red triangle menu.) Deselect this box for each column of bars to use the scale determined separately from the data in each displayed column.