Launch the Variability/Attribute Gauge Chart Platform
Launch the Variability/Attribute Gauge Chart platform by selecting Analyze > Quality and Process > Variability/Attribute Gauge Chart. Set the Chart Type to Variability.
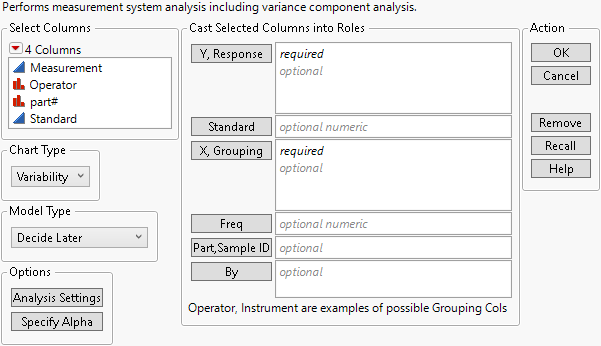
Figure 5.3 The Variability/Attribute Gauge Chart Launch Window
For more information about the options in the Select Columns red triangle menu, see Column Filter Menu in Using JMP.
Chart Type
Choose between a variability gauge analysis (for a continuous response) or an attribute gauge analysis (for a categorical response, usually “pass” or “fail”).
Note: The content in this chapter covers only the Variability chart type. For more information about the Attribute chart type, see Attribute Gauge Charts.
Model Type
Choose the model type (Main Effect, Crossed, Nested, and so on). See Statistical Details for Variance Components.
Analysis Settings
Specify the method for computing variance components. See Analysis Settings.
Specify Alpha
Specify the alpha level used by the platform.
Y, Response
Specify the measurement column. Specifying more than one Y column produces a separate variability chart for each response.
Standard
Specify a standard or reference column that contains the “true” or known values for the measured part. Including this column enables the Bias and Linearity Study options. These options perform analysis on the differences between the observed measurement and the reference or standard value. See Bias Report and Linearity Study.
X, Grouping
Specify the classification columns that group the measurements. If the factors form a nested hierarchy, specify the higher terms first. If you are doing a gauge study, specify the operator first and then the part.
Freq
Identifies the data table column whose values assign a frequency to each row. Can be useful when you have summarized data.
Part, Sample ID
Identifies the part or sample that is being measured.
By
Identifies a column that creates a report consisting of separate analyses for each level of the variable.
Data Format
To use the Variability Chart platform, all response measurements must be in a single response column. Sometimes, responses are recorded in multiple columns, where each row is a level of a design factor and each column is a level of a different design factor. Data that are in this format must be stacked before running the Variability Chart platform. See Stack Columns in Using JMP.