Publication date: 07/30/2020
Variability Gauge Charts
Evaluate a Continuous Measurement Process Using Gauge R&R
Variability gauge charts analyze continuous measurements and can reveal how your measurement system is performing. You can also perform a gauge study to see measures of variation in your data.
Tip: This chapter covers only variability charts. For more information about attribute charts, see Attribute Gauge Charts.
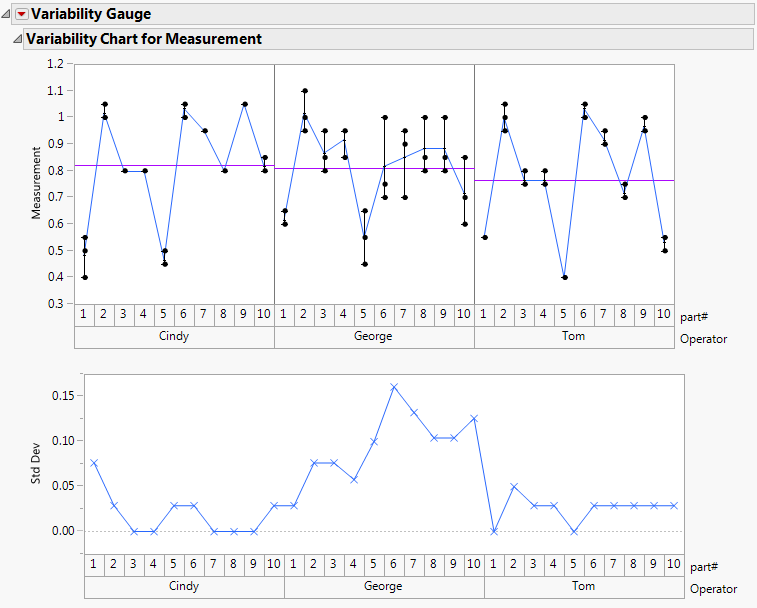
Figure 5.1 Example of a Variability Chart
Contents
Overview of Variability Charts
Example of a Variability Chart
Launch the Variability/Attribute Gauge Chart Platform
Data Format
The Variability Gauge Chart
Variability Gauge Platform Options
Heterogeneity of Variance Tests
Variance Components
About the Gauge R&R Method
Gauge R&R Option
Discrimination Ratio
Misclassification Probabilities
Bias Report
Linearity Study
Additional Examples of Variability Charts
Example of the Heterogeneity of Variance Test
Example of the Bias Report Option
Statistical Details for Variability Charts
Statistical Details for Variance Components
Statistical Details for the Discrimination Ratio
Want more information? Have questions? Get answers in the JMP User Community (community.jmp.com).