Multiple Table Format
This version of the potato chip study uses three data tables: Potato Chip Profiles.jmp, Potato Chip Responses.jmp, and Potato Chip Subjects.jmp. Although you can always arrange your data into a single table, a multi-table approach can be more convenient than a one-table analysis when you have additional profile and subject variables that you want to include in your analysis.
Complete the Launch Window
1. Select Help > Sample Data Library and open the Potato Chip Responses.jmp sample data table.
Note: If you prefer not to follow the steps for completing the launch window, click the green triangle next to the MaxDiff for Flavor script. Then proceed to Explore the Model.
2. Click the green triangle next to the Open Profile and Subject Tables script.
– The profile data table, Potato Chip Profiles.jmp, lists all the potato chip types in the study (Flavor) along with information about the country of origin (Product Of). Each choice has a Profile ID.
– The subjects data table, Potato Chip Subjects.jmp, lists the respondents. It also gives additional information about each respondent: Citizenship and Gender.
– The responses data table, Potato Chip Responses.jmp, lists the respondents. For each respondent, the Survey ID and Choice Set ID for each set of profiles is listed, along with the Profile ID values for each choice set. The table also contains response data in the Best Profile and Worst Profile columns.
3. From any of the three data tables, select Analyze > Consumer Research > MaxDiff.
4. From the Data Format list, select Multiple Tables, Cross-Referenced.
There are three separate outlines, one for each of the data sources.
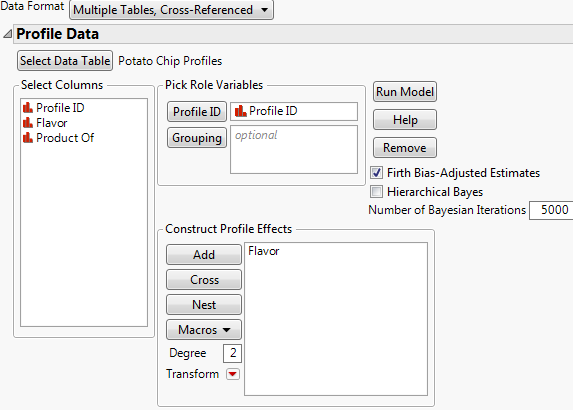
5. Click Select Data Table under Profile Data.
A Profile Data Table window appears, which prompts you to specify the data table for the profile data.
6. Select Potato Chip Profiles.jmp and click OK.
The columns from this table appear in the Select Columns.
7. Select Profile ID from the Select Columns list and click Profile ID under Pick Role Variables.
8. Select Flavor and click Add under Construct Model Effects.
Note that Product Of is another profile effect that you could add to the effects list.
Figure 5.5 Complete Profile Data Outline
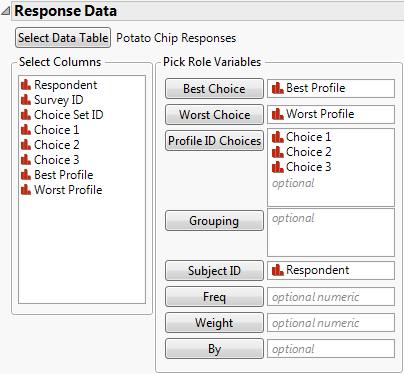
9. Open the Response Data outline. Click Select Data Table.
10. Select Potato Chip Responses.jmp and click OK.
11. Assign roles to columns as follows. The completed launch dialog is shown in Figure 5.6.
– Select Best Profile and click Best Choice.
– Select Worst Profile and click Worst Choice.
– Select Choice 1, Choice 2, and Choice 3 and click Profile ID Choices.
– Select Respondent and click Subject ID.
Figure 5.6 Completed Response Data Outline
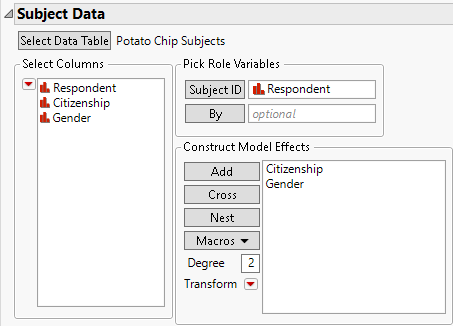
12. Open the Subject Data outline. Click Select Data Table.
13. Select Potato Chip Subjects.jmp and click OK.
14. Select Respondent and click Subject ID.
15. Select Citizenship and Gender and click Add under Construct Model Effects.
Figure 5.7 Completed Subject Data Outline
Explore the Model
1. Click Run Model.
Figure 5.8 MaxDiff Model Report
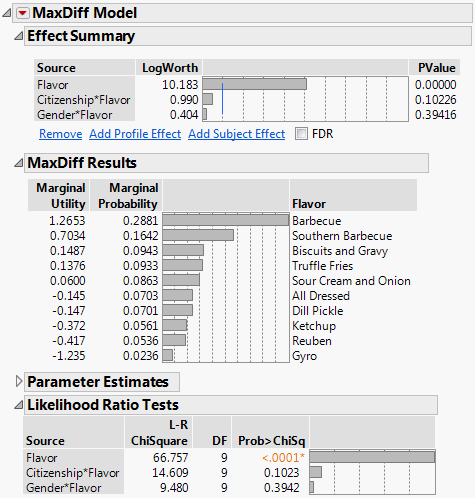
The Effect Summary report shows the terms in the model and gives p-values for their significance. Notice that Flavor is a profile effect, and that each of Citizenship*Flavor and Gender*Flavor is an interaction of a subject and a profile effect.
The Likelihood Ratio Tests report indicates that Flavor is significant.