Response Screening Personality
The Response Screening personality in Fit Model enables you to study tests of multiple responses against linear model effects.
1. Select Help > Sample Data Library and open Drosophila Aging.jmp.
2. Select Analyze > Fit Model.
3. Select all the continuous columns and click Y.
4. Select channel and click Add.
5. Select sex, line, and age and select Macros > Full Factorial.
6. Select Response Screening from the Personality list.
7. Click Run.
The Fit Response Screening report appears. Two data tables are also presented: Y Fits summarizes the overall model tests, and PValues tests the individual effects in the model for each Y.
To get a general idea of which effects are important, do the following:
8. Run the FDR LogWorth by Rank Fraction script in the PValues data table.
9. Select Rows > Data Filter.
10. In the Data Filter window, select Effect and click Add.
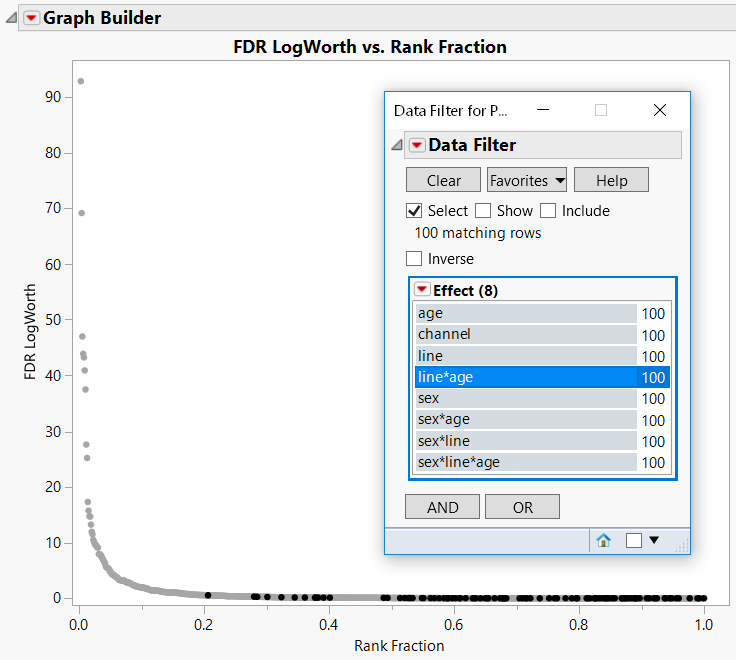
11. In the Data Filter, click through the list of the model effects while you view the selected points in the FDR LogWorth by Rank Fraction plot.
Keep in mind that values of LogWorth that exceed 2 are significant at the 0.01 level. The Data Filter helps you see that, with the exception of sex and channel, the model effects are rarely significant at the 0.01 level. Figure 21.20 shows a reference line at 2. The points for tests of the line*age interaction effect are selected. None of these are significant at the 0.01 level.
Figure 21.20 FDR LogWorth vs Rank Fraction Plot with line*age Tests Selected