The Bivariate Plot
To produce the plot shown in Figure 5.4, follow the instructions in Example of Bivariate Analysis.
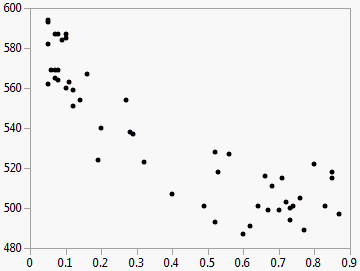
Figure 5.4 The Bivariate Plot
The Bivariate report begins with a plot for each pair of X and Y variables. Replace variables in the plot by dragging and dropping a variable, in one of two ways: swap existing variables by dragging and dropping a variable from one axis to the other axis; or, click a variable in the Columns panel of the associated data table and drag it onto an axis.
You can interact with this plot just as you can with other JMP plots (for example, resizing the plot, highlighting points with the arrow or brush tool, and labeling points). For more information about these features, see JMP Reports in Using JMP.
You can fit curves on the plot and view statistical reports and additional menus using the fitting options that are located within the red triangle menu. See Fitting Options.