Example of the Each Pair, Student’s t Test
This example uses the Big Class.jmp sample data table. It shows a one-way layout of weight by age, and shows the group comparison using comparison circles that illustrate all possible t tests.
1. Select Help > Sample Data Library and open Big Class.jmp.
2. Select Analyze > Fit Y by X.
3. Select weight and click Y, Response.
4. Select age and click X, Factor.
5. Click OK.
6. Click the red triangle next to Oneway Analysis of weight By age and select Compare Means > Each Pair, Student’s t.
Figure 6.15 Example of Each Pair, Student’s t Comparison Circles
The means comparison method can be thought of as seeing if the actual difference in the means is greater than the difference that would be significant. This difference is called the LSD (least significant difference). The LSD term is used for Student’s t intervals and in context with intervals for other tests. In the comparison circles graph, the distance between the circles’ centers represent the actual difference. The LSD is what the distance would be if the circles intersected at right angles.
Figure 6.16 Example of Means Comparisons Report for Each Pair, Student’s t
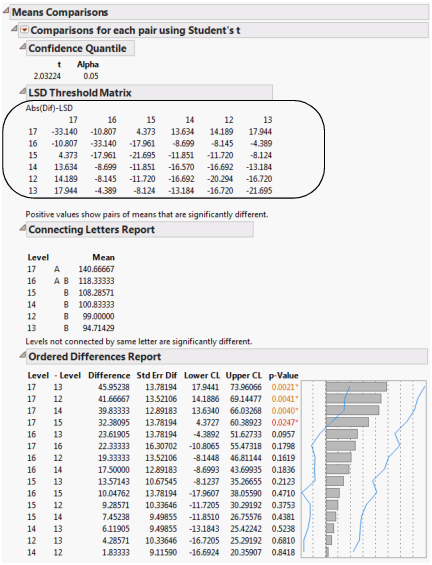
In Figure 6.16, the LSD threshold table shows the difference between the absolute difference in the means and the LSD (least significant difference). If the values are positive, the difference in the two means is larger than the LSD, and the two groups are significantly different.