For the latest version of JMP Help, visit JMP.com/help.


Basic Analysis > Oneway Analysis
Publication date: 04/28/2021

Oneway Analysis

Examine Relationships between a Continuous Y and a Categorical X Variable

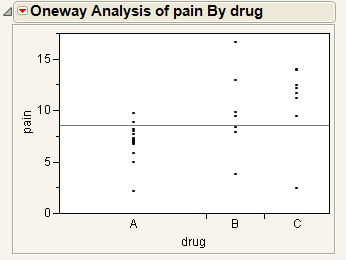
Using the Oneway or Fit Y by X platform, you can explore how the distribution of a continuous Y variable differs across groups defined by a single categorical X variable. For example, you might want to find out how different categories of the same type of drug (X) affect patient pain levels on a numbered scale (Y).

The Oneway platform is the continuous by nominal or ordinal personality of the Fit Y by X platform. The analysis results appear in a plot, and you can interactively add additional analyses, such as the following:

a one-way analysis of variance to fit means and to test that they are equal

nonparametric tests

a test for homogeneity of variance

multiple-comparison tests on means, with means comparison circles

outlier box plots overlaid on each group

power details for the one-way layout

Figure 6.1 Oneway Analysis 

Contents

Overview of Oneway Analysis

Example of Oneway Analysis

Launch the Oneway Platform

Data Format

The Oneway Plot

Oneway Platform Options

Display Options

Quantiles

Outlier Box Plots

Means/Anova and Means/Anova/Pooled t

The Summary of Fit Report
The t Test Report
The Analysis of Variance Report
The Means for Oneway Anova Report
The Block Means Report
Mean Diamonds and X-Axis Proportional
Mean Lines, Error Bars, and Standard Deviation Lines

Analysis of Means Methods

Analysis of Means for Location
Analysis of Means for Scale
Analysis of Means Charts
Analysis of Means Options

Compare Means

Using Comparison Circles
Each Pair, Student’s t
All Pairs, Tukey HSD
With Best, Hsu MCB
With Control, Dunnett’s
Each Pair Stepwise, Newman-Keuls
Compare Means Options

Nonparametric Tests

The Wilcoxon, Median, Van der Waerden, and Friedman Rank Test Reports
Kolmogorov-Smirnov Two-Sample Test Report
Nonparametric Multiple Comparisons

Unequal Variances

Tests That the Variances Are Equal Report

Equivalence Test

Robust

Robust Fit
Cauchy Fit

Power

Power Details Window and Reports

Normal Quantile Plot

CDF Plot

Densities

Matching Column

Additional Examples of the Oneway Platform

Example of an Analysis of Means Chart
Example of an Analysis of Means for Variances Chart
Example of the Each Pair, Student’s t Test
Example of the All Pairs, Tukey HSD Test
Example of the With Best, Hsu MCB Test
Example of the With Control, Dunnett’s Test
Example of the Each Pair Stepwise, Newman-Keuls Test
Example Contrasting Four Compare Means Tests
Example of the Nonparametric Wilcoxon Test
Example of the Unequal Variances Option
Example of an Equivalence Test
Example of the Robust Fit Option
Example of the Power Option
Example of a Normal Quantile Plot
Example of a CDF Plot
Example of the Densities Options
Example of the Matching Column Option
Example of Stacking Data for a Oneway Analysis

Statistical Details for the Oneway Platform

Comparison Circles
Power
Summary of Fit Report
Tests That the Variances Are Equal
Nonparametric Test Statistics
Want more information? Have questions? Get answers in the JMP User Community (community.jmp.com).