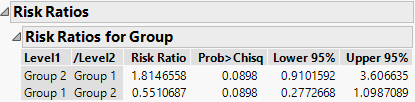
Risk Ratios for One Nominal Effect with Two Levels
To show risk ratios for effects, select the Risk Ratios option from the red triangle menu. In this example, there is only one effect, and there are only two levels for that effect. The risk ratio for Group 2 is compared with Group 1 and appears in the Risk Ratios for Group report. See Figure 15.3. The risk ratio in this table is determined by computing the exponential of the parameter estimate for Group 2 and dividing it by the exponential of the parameter estimate for Group 1.
Note the following:
• The Group 1 parameter estimate appears in the Parameter Estimates table (Figure 15.2).
• The Group 2 parameter estimate is calculated by taking the negative value for the parameter estimate of Group 1.
• Reciprocal shows the value for 1/Risk Ratio.
Tip: To see the Reciprocal values, right-click in the Risk Ratios report and select Columns > Reciprocal.
For this example, the risk ratio for Group2/Group1 is calculated as follows:
exp[-(-0.2979479)] /exp(-0.2979479) = 1.8146558
This risk ratio value suggests that the risk of death for Group 2 is 1.81 times that for Group 1.
Figure 15.3 Risk Ratios for Group Table
For information about calculating risk ratios when there are multiple effects, or categorical effects with more than two levels, see Risk Ratios for Multiple Effects and Multiple Levels.