Publication date: 04/28/2021
The Ternary Plot
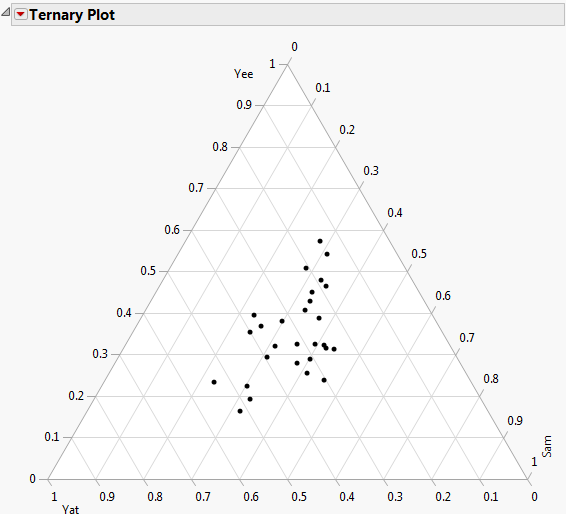
Follow the instructions in Example of a Ternary Plot to produce the plot shown in Figure 11.6.
Each of the three sides of a ternary plot represents a proportion of 0%, with the point of the triangle opposite that base representing a proportion of 100%. As a proportion increases in any one sample, the point representing that sample moves from the base to the opposite point of the triangle.
Figure 11.6 The Ternary Plot
Want more information? Have questions? Get answers in the JMP User Community (community.jmp.com).