Canonical Options
The first options listed below relate to the appearance of the Canonical Plot or the Canonical 3D Plot. The remaining options provide detail on the calculations related to the plot.
Note: The Canonical 3D Plot is available only when there are three or more covariates and when the grouping variable has four or more categories.
Options Relating to Plot Appearance
Show Points
Shows or hides the points in the Canonical Plot and the Canonical 3D Plot.
Show Means CL Ellipses
Shows or hides 95% confidence ellipses for the mean of each group in the Canonical Plot and the Canonical 3D Plot, assuming normality.
Show Normal 50% Contours
Shows or hides a 50% prediction ellipse or ellipsoid for each group. In the Canonical Plot, each ellipse depicts a region in the space of the first two canonical variables that estimates where 50% of the observations for each group should fall, assuming multivariate normality. In the Canonical 3D Plot, each ellipsoid depicts a region in the space of the first three canonical variables that estimates where 50% of the observations should fall, assuming multivariate normality.
Show Biplot Rays
Shows or hides the biplot rays in the Canonical Plot and the Canonical 3D Plot. The labeled rays show the directions of the covariates in the canonical space. They represent the degree of association of each covariate with each canonical variable.
Biplot Ray Position
Enables you to specify the position and radius scaling of the biplot rays in the Canonical Plot and in the Canonical 3D Plot.
– By default, the rays emanate from the point (0,0), which represents the grand mean of the data in terms of the canonical variables. In the Canonical Plot, you can drag the rays or use this option to specify coordinates.
– The default Radius Scaling in the canonical plots is 1.5, unless an adjustment is needed to make the rays visible. Radius Scaling is done relative to the Standardized Scoring Coefficients.
Color Points
Colors the points in the Canonical Plot and the Canonical 3D Plot based on the levels of the X variable. Color markers are added to the rows in the data table. This option is equivalent to selecting Rows > Color or Mark by Column and selecting the X variable. It is also equivalent to right-clicking the graph and selecting Row Legend, and then coloring by the classification column.
Options Relating to Calculations
Show Canonical Details
Shows or hides the Canonical Details report. See Show Canonical Details.
Show Canonical Structure
Shows or hides the Canonical Structures report. See Show Canonical Structure. Not available for the Wide Linear discriminant method.
Save Canonical Scores
Creates columns in the data table that contain canonical score formulas for each observation. The column for the kth canonical score is named Canon[<k>].
Tip: In a script, sending the scripting command Save to New Data Table to the Discriminant object saves the following to a new data table: group means on the canonical variables; the biplot rays with 1.5 Radius Scaling of the Standardized Scoring Coefficients; and the canonical scores. Not available for the Wide Linear discriminant method.
Show Canonical Details
The Canonical Details report shows tests that address the relationship between the covariates and the grouping variable X. Relevant matrices are presented at the bottom of the report.
Figure 5.13 Canonical Details for Iris.jmp
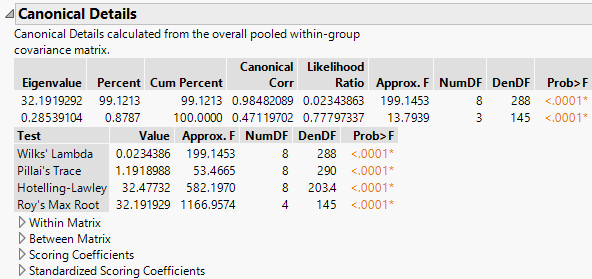
Note: The matrix used in computing the results in the report is the pooled within-covariance matrix (given as the Within Matrix). This matrix is used as a basis for the Canonical Details report for all discriminant methods. The statistics and tests in the Canonical Details report are the same for all discriminant methods.
Statistics and Tests
The Canonical Details report lists eigenvalues and gives a likelihood ratio test for zero eigenvalues. Four tests are provided for the null hypothesis that the canonical correlations are zero.
Eigenvalue
Eigenvalues of the product of the Between Matrix and the inverse of the Within Matrix. These are listed from largest to smallest. The size of an eigenvalue reflects the amount of variance explained by its associated discriminant function.
Percent
Proportion of the sum of the eigenvalues represented by the given eigenvalue.
Cum Percent
Cumulative sum of the proportions.
Canonical Corr
Canonical correlations between the covariates and the groups defined by the categorical X. Suppose that you define numeric indicator variables to represent the groups defined by X. Then perform a canonical correlation analysis using the covariates as one set of variables and the indicator variables representing the groups in X as the other. The Canonical Corr values are the canonical correlation values that result from this analysis.
Likelihood Ratio
Likelihood ratio statistic for a test of whether the population values of the corresponding canonical correlation and all smaller correlations are zero. The ratio equals the product of the values (1 - Canonical Corr2) for the given and all smaller canonical correlations.
Test
Lists four standard tests for the null hypothesis that the means of the covariates are equal across groups: Wilk’s Lambda, Pillai’s Trace, Hotelling-Lawley, and Roy’s Max Root. See Multivariate Tests and Approximate F-Tests in the Discriminant Analysis section.
Approx. F
The F value associated with the corresponding test. For certain tests, the F value is approximate or an upper bound. See Approximate F-Tests in the Discriminant Analysis section.
NumDF
The numerator degrees of freedom for the corresponding test.
DenDF
The denominator degrees of freedom for the corresponding test.
Prob>F
The p-value for the corresponding test.
Matrices
Four matrices that relate to the canonical structure are presented at the bottom of the report. To view a matrix, click the disclosure icon beside its names. To hide it, click the name of the matrix.
Within Matrix
Pooled within-covariance matrix.
Between Matrix
Between groups covariance matrix, SB. See Between Groups Covariance Matrix.
Scoring Coefficients
Coefficients used to compute canonical scores in terms of the raw data. These are the coefficients used for the option Canonical Options > Save Canonical Scores. For more information about how these are computed, see the CANDISC Procedure chapter in SAS Institute Inc. (2018b).
Standardized Scoring Coefficients
Coefficients used to compute canonical scores in terms of the standardized data. Often called canonical weights. For more information about how these are computed, see the CANDISC Procedure chapter in SAS Institute Inc. (2018b).
Show Canonical Structure
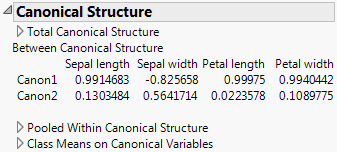
The Canonical Structure report gives three matrices that provide correlations between the canonical variables and the covariates. Another matrix shows means across the levels of the group variable. To view a matrix, click the disclosure icon beside its names. To hide it, click the name of the matrix.
Figure 5.14 Canonical Structure for Iris.jmp Showing between Canonical Structure
Total Canonical Structure
Correlations between the canonical variables and the covariates. Often called loadings.
Between Canonical Structure
Correlations between the group means on the canonical variables and the group means on the covariates.
Pooled Within Canonical Structure
Partial correlations between the canonical variables and the covariates, adjusted for the group variable.
Class Means on Canonical Variables
Provides means across the levels of the group variable for each canonical variable.