Customize Axes and Axis Labels Using the Pop-Up Menu
Right-click an axis to perform the following tasks:
• Extend Divider Lines and Frames for Categorical Axes
• Rotate Axis Labels and Tick Marks
• Copy and Paste Graph Contents
• Copy and Paste Axis Settings
Extend Divider Lines and Frames for Categorical Axes
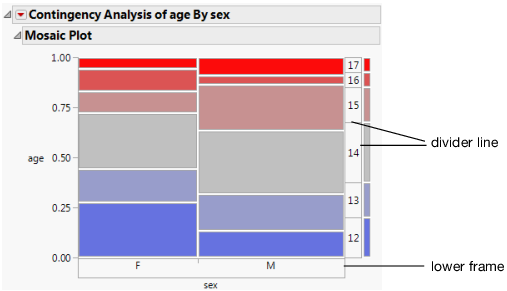
Extending the vertical divider line(s) between tick labels is useful when there are many levels of a nominal or ordinal (categorical) variable.
To extend the divider line to the x-axis labels, follow these steps:
1. Right-click a nominal or ordinal axis.
2. Select Tick Marks > Divider Lines to add the lines, or Lower Frame to add a frame around the axis area.
Figure 9.31 Divider Lines
Add and Remove Axis Labels
You can add or remove labels in a numeric axis. To add an axis label:
1. Right-click a numeric axis and select Add Axis Label.
2. Enter a name for the axis label. The axis area enlarges to hold the number of label lines that you enter.
This command can be used multiple times to add multiple labels. To edit the label after it has been added to the axis, click it and it will turn into an edit box.
To remove an axis label, right-click a numeric axis and select Remove Axis Label. The last label added is removed.
Rotate Axis Labels and Tick Marks
You can modify the axis label on any axis type.
To rotate an axis label, follow these steps:
1. Right-click an axis label.
2. Select Rotate Text.
3. Select which direction to rotate the text: Horizontal, Left, or Right.
Tip: To set a default axis label position for a variable, which avoids making this change every time you run an analysis, see Properties That Control the Display of Columns in the The Column Info Window section.
On a nominal axis, you can rotate tick marks. Right-click the tick label and select Rotated Tick Labels.
Copy and Paste Graph Contents
After customizing a graph by adding elements such as a fitted line, you can copy and paste the contents from one graph to another compatible graph:
1. Right-click the graph that you have customized.
2. Select Edit > Copy Frame Contents.
3. Right-click the graph to which you would like to copy the settings.
4. Select Edit > Paste Frame Contents.
Tip: If you are having difficulty pasting histogram bars, see the JSL workaround in Copy and Paste Histograms in the Scripting Guide.
Copy and Paste Axis Settings
After customizing an axis (as described in Customize Axes and Axis Labels in the Axis Settings Window), you can copy and paste your new settings to another axis:
1. Right-click the axis that you have customized.
2. Select Edit > Copy Axis Settings.
3. Right-click the axis to which you would like to copy the settings.
4. Select Edit > Paste Axis Settings.
Tip: To broadcast the axis settings to multiple graphs, hold down the Ctrl key when you right-click the axis and select Edit > Paste Axis Settings.