Statistical Functions
There are two types of Statistical functions that you can use in a formula:
• The functions with names that have the prefix Col. These functions compute statistics for a column of numbers or expressions involving columns.
• The Mean, Std Dev, Number, Sum, Quantile, Maximum, Minimum, and N Missing functions. These functions evaluate across columns or arguments. The statistic is computed for each row across the series of arguments. You can use the insert key ( ) on the on-screen keypad, or type a comma to add arguments to the functions that accept multiple arguments. When there are multiple contiguous arguments, select the function and the first argument, and then Shift-click the last argument in the group. These functions then automatically show with the complete list.
Note: Missing values are ignored in statistical functions.
See Statistical Functions in the JSL Syntax Reference for more information about syntax.
Col Cumulative Sum
Returns the cumulative sum for the current row. Col Cumulative Sum supports By columns, which do not need to be sorted.
Col Mean
Calculates the mean (or arithmetic average) of the numeric values identified by its argument. The formula Col Mean(age) calculates the average of all nonmissing values in the age column.
Col Moving Average
Returns the moving average over a given interval based at the current row. Missing values are ignored
Col Std Dev
Measures the spread around the mean of the distribution identified by its argument. In the normal distribution, about 68% of the distribution is within one standard deviation of the mean. 95% of the distribution is within two standard deviations of the mean. 99% of the distribution is within three standard deviations of the mean.
Col Number
Counts the number of nonmissing values in the column that you specify. A missing numeric value occurs when a cell has no assigned value or is the result of an invalid operation (such as division by zero). Missing values show on the spreadsheet as a missing value mark (•). Missing character values are null character strings. In formulas for row state columns, an excluded row state characteristic is treated as a missing value.
Col N Missing
Counts the number of missing values in the column that you specify. A missing numeric value occurs when a cell has no assigned value or is the result of an invalid operation (such as division by zero). Missing values show in the data grid with a missing value character (•). Missing character values are null character strings.
Col Sum
Computes the sum of the values in its numeric argument. Missing values are ignored.
Col Minimum and Col Maximum
Takes the minimum of its numeric arguments. Col Minimum ignores missing values. Col Maximum takes the maximum of a numeric column argument and ignores missing values.
Col Quantile
Computes the value at which a specific percentage of the values is less than or equal to that value. For example, the value calculated as the 50% quantile, also called the median, is greater than or equal to 50% of the data. Half of the data values are less than the 50th quantile.
The Col Quantile function’s quantile argument represents the quantile percentage divided by 100. The 25% quantile, also called the lower quartile, corresponds to p = 0.25, and the 75% quantile, called the upper quartile, corresponds to p = 0.75.
The Formula Editor computes a quantile for a column of n nonmissing values by arranging the values in ascending order. The subscripts of the sorted column values, y1, y2,...,yn, represent the ranks in ascending order.
The pth quantile value is calculated using the formula p(n + 1), where p is the percent value and n is the total number of nonmissing values. If p(n+1) is an integer, then the quantile value is yp(n+1). If p(n + 1) is not an integer, then the value is interpolated by assigning the integer part of the result to i, assigning the fractional part to f, and applying the formula (1 – f)yi + (f)yi+1.
For example, suppose a column has values 2, 4, 6, 8, 10, 12, 14, 16, 18, and 20. The 50% quantile is calculated as 0.5(10 + 1) = 5.5.
Because the result is fractional, the 50% quantile value is interpolated as
(1 – 0.5) x 10 + (0.5) x 12 = (0.5)10 + (0.5)12 = 6 + 5 = 11
The following are example ColQuantile formulas:
• ColQuantile(age, 1) Calculates the maximum age.
• ColQuantile(age, 0.75) Calculates the upper quartile age.
• ColQuantile(age, 0.5) Calculates the median age.
• ColQuantile(age, 0.25) Calculates the lower quartile age.
• ColQuantile(age, 0) Calculates the minimum age.
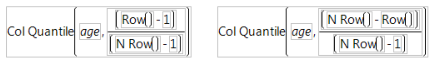
The ColQuantile argument can be any expression that evaluates to a value between (and including) 0 and 1. For example, the first formula in Figure A.12 calculates quantile values of age in ascending order for each row. The column then contains the interpolated values of age in ascending order in the calculated column. The second formula lists the interpolated values of age in descending order.
Figure A.12 Examples of the Quantile Function
Col Rank
Ranks each row’s value, from 1 for the lowest value to the number of non-missing columns for the highest value. Ties can be broken by reporting the average of the possible rankings, assigning the ranks in the order that they originally appear, giving both values the lowest possible rank, or arbitrarily. (JMP 12 used arbitrary tie breaking.) Distribution’s Normal Quantile output uses average tie breaking.
Col Standardize
Performs the usual standardization on its numeric expression. For each row i, Col Standardize(height) is (HeightRow()–Col Mean(Height))/Col Std Dev(Height).
Mean
Calculates the arithmetic average of the nonmissing values in the list of arguments that you specify. The arguments can be constants, numbers, or expressions. The Mean function initially shows with a single argument. You add arguments with the insert button () on the Formula Editor keypad or by typing a comma.
Std Dev
Computes standard deviation of the nonmissing values in the list of arguments that you specify. The arguments can be constants, numbers, or expressions. The Std Dev function initially shows with a single argument. You add arguments by clicking the insert button () on the Formula Editor keypad or by typing a comma.
Number
Counts the number of nonmissing values in the list of arguments that you specify.
Sum
Returns the sum of the nonmissing values in the list of arguments that you specify.
Quantile
Calculates the quantile specified by the first argument for all the nonmissing values in the remaining list of arguments that you specify.
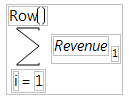
Summation (Σ)
Evaluates for an explicit range of values in a column, as given by the summation indices. This behavior is different from all other statistical functions (except Product), which always evaluate on every row. The Summation function uses the summation notation shown in Figure A.13. To calculate a sum, replace the missing body term with an expression containing the index variable i, or an index variable that you assign. Summation repeatedly evaluates the expression for i = 1, i = 2, through i = NRow() and then adds the nonmissing results together to determine the final result.
You can replace NRow(), the number of rows in the active spreadsheet, and the index constant, i, with any expression appropriate for your formula. For example, the summation formula in Figure A.13 computes the total for each row of all revenue values for rows 1 through the current row number, filling the calculated column with the cumulative totals of the revenue column.
Figure A.13 Example of the Summation function
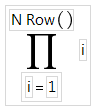
Product (Π)
Evaluates for an explicit range of values in a column, as given by the summation indices, as opposed to all other statistical functions (except Summation), which always evaluate on every row. Product uses the notation shown in the formula in Figure A.14. To calculate a product, replace the missing body term with an expression containing the index variable j. Product repeatedly evaluates the expression for i = 1, i = 2, through i = n and multiplies the nonmissing results together to determine the final result.
You can replace NRow(), the number of rows in the active spreadsheet and the index constant, i, with any expression appropriate for your formula.
For example, the product example in Figure A.14 calculates i! (each row number’s factorial).
Figure A.14 Examples of the Product Function
Minimum and Maximum
Return the minimum and maximum value, respectively, from the list of nonmissing arguments that you specify.
N Missing
Counts the number of missing values in the list of arguments that you specify.
SSQ
Returns the sum of squares of all elements.