Update Names and Values in Hover Labels Using Gridlets
A gridlet supports the full customization of the hover label name and value pairs that reflect the underlying visual data. Data can be added, removed, or renamed. You can also change the style and numeric formats.
When you place your pointer over a visualization in a graph, you see content in the hover label for that marker. A grid entry is text that appears on the hover label by default, either from the label columns or from the columns associated with the visualization. By default, the column names that are assigned to roles (and their corresponding values) are shown, along with columns that are labeled. You can customize these column names or values or add other content. Here are a few things you can do:
• add or remove a column name and its value
• rename a grid label
• add a new grid entry with a dynamic value and an optional click action. For example, you can insert an entry named “See also” with a clickable link to a Wikipedia page as the value.
• applying a style to text (for example, formatting text in bold)
• formatting numeric values (for example, setting the number of decimal places to 2)
Figure 12.46 shows adding Genre, Name, and Length in minutes, reformatting the minutes, and formatting “Genre” in bold.
Figure 12.46 Customized Gridlet

Example of Customizing a Gridlet
The following script creates the graph and hover label shown in Figure 12.46.
Names Default To Here( 1 );
dt = Open( "$SAMPLE_DATA/Movie Inventory.jmp" );
// launch the baseline visualizationdt << Graph Builder(Size( 534, 456 ),
Show Control Panel( 0 ),Variables( X( :Year ), Y( :Length ) ),
Elements( Points( X, Y, Legend( 3 ) ), Smoother( X, Y, Legend( 4 ) ) ),
SendToReport(
Dispatch(
{}, "Graph Builder",FrameBox,
{Set Gridlet( // delete the Length column Expunge( {{Matcher( "Length" )}} ), // add the Name, Genre, and Length in minutes columnsAnnex(
{{Matcher( "Name" ), value( :Name[local:_firstRow] )}, {Matcher( "Genre" ), value( :Genre[local:_firstRow] )}, {Matcher( "Length in minutes" ), value( local:_Length * 60 )}}),
Reformat(
// reformat the Length in minutes format {{Matcher( "Length in minutes" ), Format( "hr:m", 80 ), 80}}),
Style(
// format "Genre" in bold nine-point text {{Matcher( "Genre", Scope( Name ) ), Font("Segoe UI", 9, "Bold")}}
)
), Add Pin Annotation(
Seg( Marker Seg( 1 ) ), Index( 33 ), Index Row( 33 ), UniqueID( 610643713 ), FoundPt( {508, 199} ), Origin( {1964.8951552795, 199.00456244898} ), Tag Line( 1 ))}
)
)
);
Gridlet Commands
The first argument in all Set Gridlet commands is a matcher, which identifies its scope of action (the grid entries it affects). A matcher can refer to the following:
• A single grid entry: by name, matching against a string. A grid entry is text that appears on the hover label by default, either from the label columns or from the columns associated with the visualization.
• Multiple grid entries: by column reference, regular expression or using the argument All.
For example, a grid entry for Mean(height) can be matched against the following:
• the name Name("Mean(height)")
• the column reference :height
• the regular expression PatReg("^.*\(height\)$")
• the special argument All, which always matches all rows in the grid.
If there is a match, the command-associated action is carried against the matching entries using the arguments.
The exception is the Annex command, which adds a new entry to the grid if there are no matches with existing entries (to avoid unplanned naming collisions).
Example of Adding and Deleting Columns
This example describes how to use the Expunge command to remove the first entry added to the hover label when the underlying table has no Label columns, followed by two instances of the Annex command to add new rows. Note that you could have used a single Annex instance and passed to it a list of lists instead.
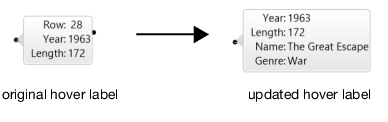
Figure 12.47 shows the original hover label and the updated hover label. Notice that Row was removed from the label. Name and Genre were added.
Figure 12.47 Example of the Expunge and Annex Commands
The following script creates the updated hover label shown in Figure 12.47.
Names Default To Here( 1 );
dt = Open( "$SAMPLE_DATA/Movie Inventory.jmp" );
// create the baseline visualizationgb = dt << Graph Builder(Size( 526, 454 ),
Show Control Panel( 0 ),Variables( X( :Year ), Y( :Length ) ),
Elements( Points( X, Y, Legend( 3 ) ), Smoother( X, Y, Legend( 4 ) ) )
);
rpt = gb << Report();box = rpt[Framebox( 1 )];box << Set Gridlet( // delete Row Expunge( {{Matcher( 1 )}} ),Annex(
// add the Name and Genre columns to the hover label {{Matcher( "Name" ), value( :Name[local:_firstRow] )}, {Matcher( "Genre" ), value( :Genre[local:_firstRow] )}})
);
Annex (Append)
Annex({matcher, value(<script>), <Click(<script>)>}) adds a new row to the hover label grid. The Annex command corresponds to the Append tab in the Hover Label Editor Gridlet panel.
This command takes three arguments:
• Matcher: The new name. Matcher should not match existing names.
• Value: Required. The script is evaluated in the Hover Label Execution Context. The result is the value that appears for the new row. See Work with the Hover Label Execution Context for details.
• Click: Optional. Click is evaluated in the Hover Label Execution Context when the user clicks on annexed entry value. This option is equal to the Click attribute in graphlets. If present, the value portion of the new entry is rendered using a link style (blue text color with an underline) to indicate that it can be clicked.
box << Set Gridlet(
Annex( { "LDL, HDL", value(Char(:LDL[local:_firstRow]) || ", " || Char(:HDL[local:_firstRow])
) })
);
Expunge (Delete)
Expunge({Matcher}) deletes the matcher. The Expunge command corresponds to the Delete tab in the Hover Label Editor Gridlet panel.
All matching entries are removed from the grid.
box << Set Gridlet( Expunge( {"age"} ) );Rename
Rename({Matcher, Value(<string>)}) replaces the name portion of the matched entry or entries with the given value. The Rename command corresponds to the Rename tab in the Hover Label Editor Gridlet panel.
box << Set Gridlet( Rename( {Matcher( "name" ), Value( "students" )} ), );Reformat
Reformat({Matcher, <format>}) takes a matcher and an argument that specifies a format to be applied to the matched row (or rows) grid numerical value or values. Matching entries are changed to reflect the specified format.
box << Set Gridlet( Reformat( {:height, Format( "Scientific", 10, 4 )} ) );Style
Style({Matcher, <style1>, <style2>, ...}) takes a matcher and one or more style arguments. Supported styles are as follows:
• Background Color
• Text Color
• Font (which further supports font family, size and style)
• Justification (left, center, or right)
• Matching entries are changed to reflect the specified styles.
box << Set Gridlet(
Style(
{{Matcher( "sex" ), Text Color( "Red" ), Font("Papyrus", 14,"Bold Underline")}}
)
);