Work with the Hover Label Execution Context
Hover Label Execution Context variables define the environment in which your graphlet and textlet scripts are executed.
Local Data Filter
When defining a graphlet, you specify how to visualize the data that appears as a thumbnail. But how do you specify which rows should be displayed?
This information is specified indirectly when the user places the pointer over different visual elements of the baseline graph (the graph to which a graphlet definition was added). Suppose that the baseline graph is a bar chart. Placing the pointer over one of the bars indicates that all the rows behind that bar (and only those rows) should be included in the generation of the visualization. This visualization shows up as a thumbnail on the hover label. In other words, the hovered visual element provides the data context in which the visualization is generated.
This data context is expressed in a where clause that is computed by JMP based on:
• the type of graph used in the baseline visualization
• the columns assigned to its different roles
• the current values for the particular visual element being inspected
The resulting where clause is then used to create a local data filter that is assigned to the platform specified in the graphlet definition.
The following graph roles are supported as sources for the creation of local data filters:
• X, including nested columns
• Y, if not representing a summary statistic or other calculation
• overlays
Numeric columns are used in comparison to a single value or checked for inclusion in a range, depending on the underlying visualization type. Visualizations that group numeric data in bins such as histograms and heat maps (and the box in box plots) result in the use of corresponding ranges in the where clause.
If present, the where clause of a Local Data Filter associated with the baseline visualization is captured as well.
Local Scope Context
The JSL expressions that configure different aspects of a graphlet and other hover label extensions (such as the textlet Setup and the gridlet Append and Click scripts) are executed inside a local namespace. This namespace is initialized with local variables that reveal information from the execution context: the hover label grid entries and references to the underlying visual element and associated data. These variables are used extensively by the graphlet presets.
Figure 12.4 describes variables that are provided in a graphlet local namespace. See Complete Example of the Hover Label Execution Context Variables.
Note: To see the variables at work, right-click on a graph, select Hover Label Editor, select the Graphlet panel, and then select one of the presets. The code that appears in the Picture field illustrates how many of the Hover Label Excecution Context variables are used to control the graphlet’s behavior.
|
Variable |
Description |
|---|---|
|
_mode |
A string indicating the current evaluation context. Values include Picture, Click, Textlet, Graphlet, and Other. You can use _mode to customize a Graph Builder expression to show more or less information. From the JMP log: {"_mode", "Textlet"},
Example from the Bar preset: If( local:_mode == "Picture", local:sizeDef = "Size( 200, 250 ),"; local:l = 0; , local:sizeDef = ""; local:l = 1; ); Note: Other means the other attributes that take expressions (for example, SkipFiltersFlag). |
|
_groupings |
A list of the current grouping (X or overlay roles) data column references. See Example of Defining the Context of a Scatterplot Matrix and Ellipse. {"_groupings", {:sex}}
|
|
_measurements |
A list of the current measurements (Y role) data column references. {"_measurements", {:height}}
|
|
_filters |
A list of the current local data filter data column references. {"_filters", {:sex}}
|
|
_where |
A textual representation of the where clause associated with the hovered visual element. The expression is parsed to be used with JSL statements that take where clauses such as Get Rows Where. _where is useful to cache complex calculations that are based on context. expr = Parse( local:_where ); r = local:_dataTable << Get Rows Where( expr ); ss = dt << Subset( Private, Invisible, Rows( r ) ); Summarize( ss, exg = By( :sex ), exm = Mean( :height ) ); Another example: {"_where", ":sex == \!"F\!""}
|
|
_whereExpr |
The where clause that is associated with the hovered visual element as a JSL expression. local:_h = Round(Mean( :height[local:_dataTable << Get Rows Where( local:_whereExpr )] ), 2); Another example: {"_whereExpr", :sex == "F"}
|
|
_displaySegName |
The class name of the underlying seg. Useful when creating descriptive text or in the definition of graph-dependent drill-down logic. Title("Graphlet for " || local:_displaySegName ||
", depth is " || Char( local:_drillDepth )) Another example: {"_displaySegName", "BarSeg"}
|
|
_dataTable |
A reference to the underlying data table. Useful for creating subsets. See Add Rich Text to Hover Labels Using Textlets for an example. {"_dataTable", Data Table( "Big Class" )}
|
|
_summaryStatistic |
A string with the current summary statistic. Useful for passing to new graphs in a drill down. {"_summaryStatistic", "Mean"}
|
|
_drillDepth |
An integer that indicates how many drill-down levels have been opened before. Useful to limit drill-down chains or to control SkipFilters logic. See Example of Defining the Context of a Scatterplot Matrix and Ellipse {"_drillDepth", 1}
|
|
_firstRow |
The 1-based index of the first row associated with the hovered visual element. See Example of Adding and Deleting Columns. {"_firstRow", 1}
|
|
_underlyingRows |
The count of rows associated with the visual element that appears in the hover label. You can use this variable to decide the type of the visualization based on the number of rows to display, going from the low granularity of a heat map to a dense marker plot if the number of rows is small enough (and vice versa). See Reapply for an example. {"_underlyingRows", 18}
|
In addition to these variables, a variable is defined for each of the hover label grid entries. The name of this variable is taken for the grid entry name, with a '_' prefix.
Note: See Example of Defining the Context of a Scatterplot Matrix and Ellipse for examples of these variables.
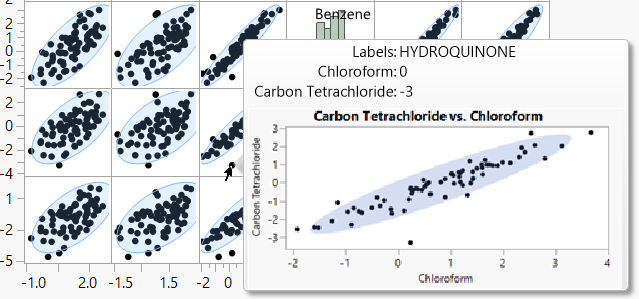
As an example, using Hover Label Execution Context variables, you can create a scatterplot matrix, place your pointer over a point to show a close-up ellipse, and then click the ellipse to modify it in Graph Builder. The graphlet shows the same visualization as the one in the underlying scatterplot matrix cell (a scatterplot of the two columns associated with that cell).
Clicking on the thumbnail then has the effect of “extracting” the cell from the matrix and opening it up as an independent visualization.
The script shown in Example of Defining the Context of a Scatterplot Matrix and Ellipse enables the user to extract the matrix cells in the main scatterplot matrix.
Figure 12.49 Viewing an Ellipse in a Scatterplot Matrix
Example of Defining the Context of a Scatterplot Matrix and Ellipse
The following script shows an example of using the context in which the script runs. This script creates the scatterplot matrix shown in Figure 12.49.
Names Default To Here( 1 );
dt = Open( "$SAMPLE_DATA/Solubility.jmp" );
win = New Window( "Scatterplot Matrix Graphlet Example",
plt = dt << Multivariate(Y(
:Name( "1-Octanol" ),
:Ether,
:Chloroform,
:Benzene,
:Carbon Tetrachloride,
:Hexane
),
Estimation Method( "Row-wise" ), Scatterplot Matrix( Density Ellipses( 1 ), Shaded Ellipses( 1 ), Ellipse Color( 69 ), Horizontal( 1 ))
)
);
frame = win << xpath( "//FrameBox" );
frame << Set Graphlet(Picture(
Show( local:_displaySegName );
If( local:_displaySegName == "MarkerSeg", // scatterplot cells Graph Builder(Size( 400, 200 ),
Show Control Panel( 0 ), Show Legend( 0 ),Variables(
X( local:_groupings[1] ), Y( local:_groupings[2] )),
Elements( Points( X, Y ), Ellipse( X, Y ) )
),
// else histograms in matrix diagonalIf( local:_N > 5, /* Note: only present if baseline graph
is a histogram.*/ Graph Builder(Size( 400, 400 ),
Show Control Panel( 0 ), Show Legend( 0 ), Variables( X( local:_groupings[1] ) ),Elements( Histogram( X ) )
),
Graph Builder(Size( 400, 400 ),
Show Control Panel( 0 ), Show Legend( 0 ), Variables( X( local:_groupings[1] ) ),Elements( Points( X ) )
)
)
);
),
// skip filters if you are at the first drill level -- the original graphSkipFilters( local:_drillDepth == 1 ), // no list -- all filters
Title( "Graphlet" ),Reapply( local:_displaySegName == "HistSeg" & local:_N > 5 )
);
Complete Example of the Hover Label Execution Context Variables
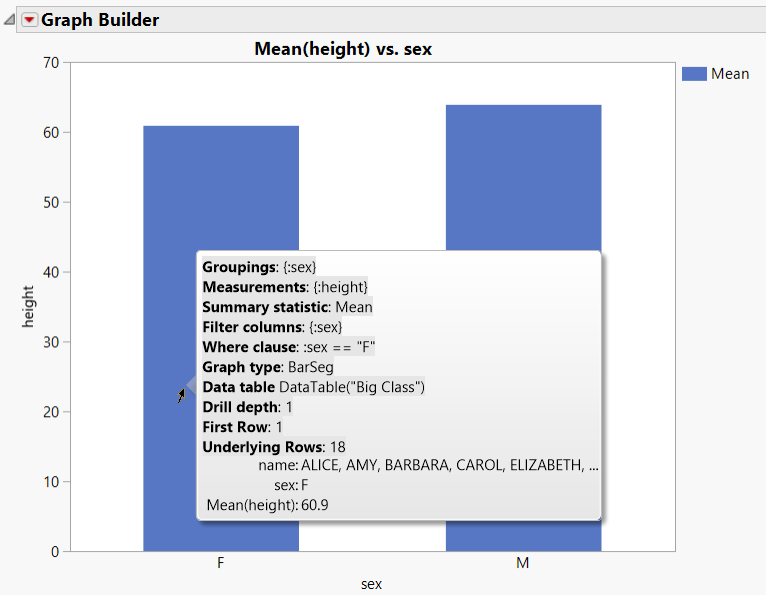
The following script produces the graph shown in Figure 12.50. When you place your pointer over a bar, the hover label appears. Details about the data and the Hover Label Context Execution variables appear in the log.
dt = Open( "$SAMPLE_DATA/Big Class.jmp" );dt << Graph Builder(Size( 528, 450 ),
Show Control Panel( 0 ),Variables( X( :sex ), Y( :height ) ),
Elements( Bar( X, Y, Legend( 3 ) ) ),SendToReport(
Dispatch(
{}, "Graph Builder",FrameBox,
{Set Textlet(Setup(
local:encodedWhere = XML Encode( local:_where ); /* Show() provides additional information about the HLEC variables in the log */Show( Namespace( "local" ) << Get Contents() );
),
Markup(
"<b>Groupings</b>: {local:_groupings}<b>Measurements</b>: {local:_measurements}<b>Summary statistic</b>: {local:_summaryStatistic}<b>Filter columns</b>: {local:_filters}<b>Where clause</b>: {local:encodedWhere}<b>Graph type</b>: {local:_displaySegName}<b>Data table</b> {local:_dataTable}<b>Drill depth</b>: {local:_drillDepth}<b>First Row</b>: {local:_firstRow}<b>Underlying Rows</b>: {local:_underlyingRows}")
)}
)
)
);
Figure 12.50 Bar Chart with Textlet