Update an Existing Display
Sometimes, you do not know how many display boxes will appear in a future report. For example, you might write a generic script that analyzes and reports on one or more variables. You do not know how many display boxes are needed, because the number of variables can change from one run of the script to the next.
The following sections describe how to add and delete display boxes from a report using Append(), Prepend(), Delete(), and Sib Append().
Append
Use the Append message to add a display box to the bottom of an existing display. In the script, construct a single, empty box, then append boxes to it for each variable in the analysis. You can also use the Append message to modify an existing display with custom information or organization.
The following code example assumes that there is a list of effect names in the variable effectsList, and that each one corresponds to a column in a matrix varprop. In other words, effectsList[1] is the label for varprop[0,1]; effectsList[2] is the label for varprop[0,2]; and so on.
varprop = [0 1 2, 3 4 5, 6 7 8];
effectsList = {"one", "two", "three"};
First, an empty Outline Box containing an H List Box is created. The interior empty container is given the name hb:
win = New Window( "H List Box Example",
Outline Box( "Variance Proportions", hb = H List Box() )
);
Then, a for loop steps through the effectsList and adds a Number Col Box for each element of effectsList:
For( i = 1, i <= N Items( effectsList ), i++,
Eval(
Substitute(
Expr(
hb << Append(
Number Col Box( effectslist[i], varprop[0, i] )
)
),
Expr( i ), i
)
)
);
Sib Append() is similar to Append() but makes the display box a sibling of the last child display box. For an example that compares Append() to Sib Append(), see Figure 11.24.
Prepend
The Prepend message works just like Append but adds the item at the beginning of the display box rather than at the end. If the display box is one of several that do not allow appending, then Prepend delegates the command to a child display box that can accept the command. It is fine to apply it to the top of the tree.
For example, the following example creates a Bivariate report with a button box at the top.
dt = Open( "$SAMPLE_DATA/Big Class.jmp" );
biv = dt << Bivariate( Y( height ), X( weight ), Fit Line );
/* select the first outline box in the biv report layer
send the Prepend message to the first outline box */
(biv << Report)(Outline Box( 1 )) << Prepend(
// prepend a button box that fits a quadratic curve
Button Box( "Click here for curve", biv << Fit Polynomial( 2 ) )
);
Click the Click here for curve button to add a quadratic curve to the graph.
You can accomplish the same thing by appending the button to the top of the tree:
dt = Open( "$SAMPLE_DATA/Big Class.jmp" );
biv = dt << Bivariate( Y( height ), X( weight ), Fit Line );
biv << Report << Prepend( // send the prepend message to the report
// prepend the button box to the top of the report
Button Box( "Click here for curve", biv << Fit Polynomial( 2 ) )
);
Delete
The Delete message removes the specified display box and all its children from the report. This is useful with the Append and Prepend messages for building completely dynamic displays. In the example below, a text box is replaced with another text box. In this case, the script could have used Set Text, but many display boxes cannot change their content.
win = New Window( "X",
list = V List Box(
t1 = Text Box( "t1" ),
t2 = Text Box( "t2" )
)
);
t1 << Delete;
list << Append( t1 = Text Box( "t1new" ) );
Note: Avoid deleting display boxes from a JMP platform. Send the Hide( 1 ) message or the Visibility( "Hidden" ) message to the display box that you want to hide.
Sib Append
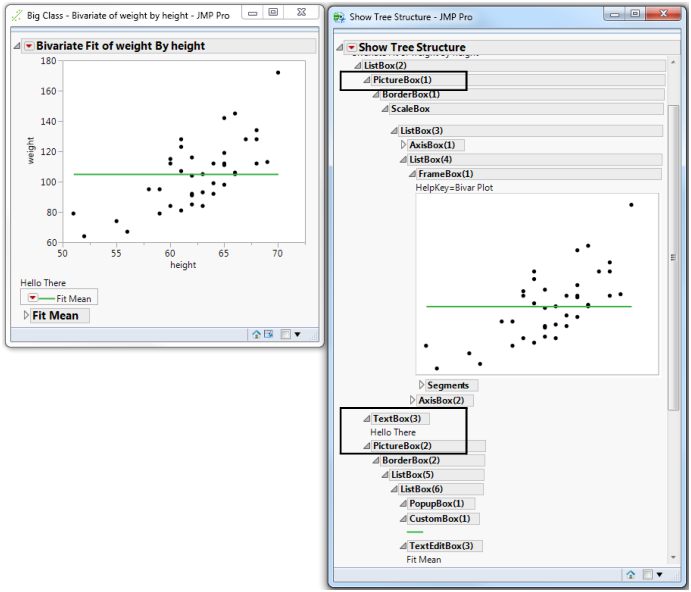
You can use the Sib Append message to add a display box immediately after an existing display box. Figure 11.23 shows two picture box trees. Picture Box( 1 ) holds the Bivariate scatterplot. Picture Box( 2 ) holds the Fit Mean menu, determined by seeing the green line and the Fit Mean text box.
Suppose you wanted to insert a text box in between these two boxes. You want to append a sibling to Picture Box( 1 ), so you send it the Sib Append message:
dt = Open( "$SAMPLE_DATA/Big Class.jmp" );
biv = dt << Bivariate(
Y( :weight ),
X( :height ),
Fit Mean( {Line Color( {57, 177, 67} )} )
);
/* the report function takes the biv object and returns a report object.
append the text box immediately after the first picture box */
Report( biv )[Picture Box( 1 )] << Sib Append( Text Box( "Hello There" ) );
Figure 11.23 Appending a Sibling Text Box
Note: In Figure 11.23, the appended sibling text box appears below the first picture box in the Show Tree Structure View window. In the classic Show Tree Structure View window, siblings appeared next to each other in the display tree. See View the Display Tree.
Figure 11.24 shows the difference between and Append() and Sib Append(). Append() makes the display box a child of the parent display box. Sib Append() makes the display box a sibling of the last display box.
Figure 11.24 Append (Left) and Sib Append (Right)
Note: If the parent display box is not a V List Box(), Sib Append() wraps that display box in V List Box().

