View a Running Dashboard
When you view a running dashboard, the same red triangle options that you find in JMP platforms are available in the reports. Dashboard Builder also provides several other options.
View a Report Summary
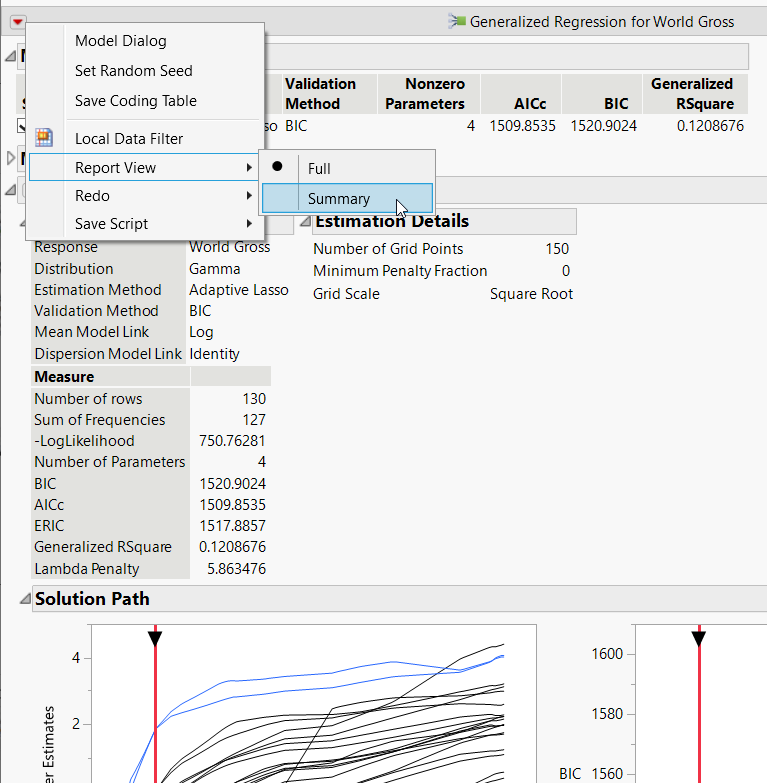
A report that contains graphs and statistics can grow fairly large. To view only the graphs while running the report, select the top red triangle in a report and then select Report View > Summary. The report shown in Figure 11.8 originally showed parameter estimates. In the Summary view, only the graphs are shown.
Figure 11.8 Viewing a Summary of the Report
Rearrange Reports in a Running Dashboard
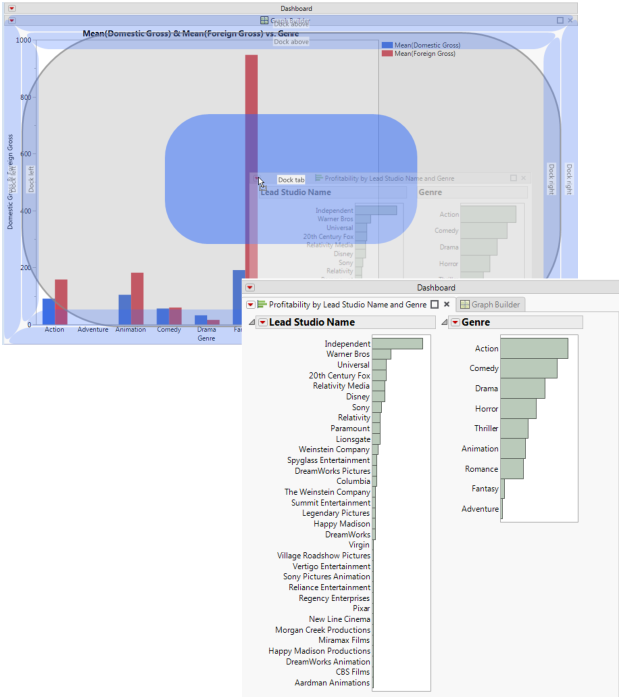
You rearrange reports in a running dashboard by dragging the reports into highlighted drop zones. The drop zones indicate where you can place the report. Figure 11.9 shows an example of moving a report into a tab. The Distribution report is dropped inside the “Dock tab” drop zone to place it on the first tab.
Figure 11.9 Creating Tabbed Reports in a Running Dashboard
To remove a tabbed report, click the middle of the report and drag it outside of the tab.
Maximize a Report in a Running Dashboard
To see only a specific report while running a dashboard, select the report’s Maximize Tab box.
Figure 11.10 Maximizing a Tab
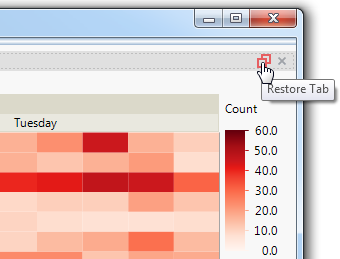
To restore the report to its original size, select the Restore Tab box.
Figure 11.11 Restoring a Maximized Report
Resize Reports in a Running Dashboard
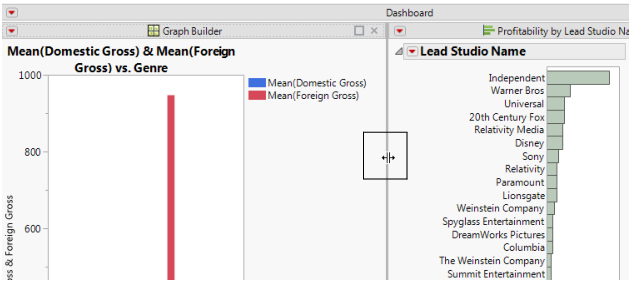
The thick gray line that appears between reports in a dashboard is called a splitter. Drag the splitter to resize the panes. When the pane is too wide to display the enclosed report, the pane closes. Drag the splitter from the outer edge of the dashboard to see all reports again. Figure 11.12 shows the collapsed and expanded reports.
Figure 11.12 Resizing Panes in a Running Dashboard
You can also drag the edge of a graph. The graph widens as far as the width of the window and the other reports allow.
Share Reports with Users Working Outside JMP
You can share reports with users working outside JMP by saving a dashboard as interactive HTML. First, click the Dashboard Builder red triangle and select Run Dashboard to run the dashboard. In the running dashboard, select File > Save As and then select Interactive HTML with Data from the list. The reports are saved in a web page that also contains the data. Email the web page to users or publish the page on a website. Users then explore the data as they would in JMP. See Share Reports as Interactive HTML.
Edit a JMP Platform Script
A dashboard consists of a JSL script, which you can edit in Dashboard Builder. For example, you might edit the script for the Multivariate platform to show the scatterplot matrix or to use different columns.
Right-click the object for a platform in the dashboard and select Edit Platform Script. The script opens in a script editor window.
After you edit the script and click OK, the object on the workspace is updated.


