View Patterns of Missing Data in Data Tables
If your data table contains missing data, you might want to determine whether there is a pattern to the missing data. The pattern might help you make discoveries about your data.
To view patterns of missing data, follow these steps:
1. With your data table open, select Tables > Missing Data Pattern.
2. Select the columns for which you would like to find patterns of missing data.
3. Click Add Columns.
4. Select Count Missing Value Codes to count missing value codes as missing values.
5. Select Add Value Colors Property to consistently color columns that contain 0 or 1 (missing value indicators).
For example, nonmissing is always colored blue, missing is always colored red. This is especially helpful for data tables that might have similar values across columns.
6. Click OK.
Example of Viewing Patterns of Missing Data
1. Select Help > Sample Data Library and open Missing Data Pattern.jmp.
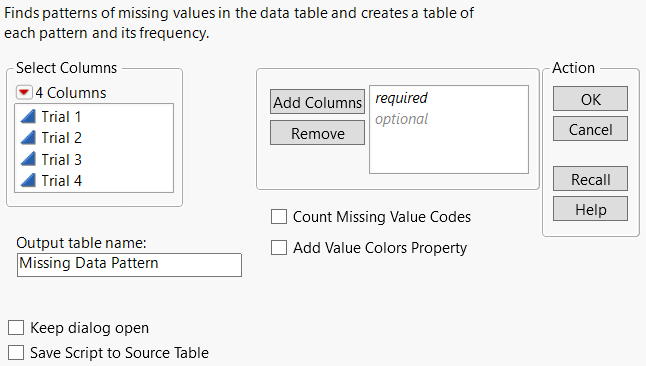
2. Select Tables > Missing Data Pattern.
Figure 4.18 The Missing Data Pattern Window
3. Highlight all of the columns.
Note: For more information about the options in the red triangle menu, see Column Filter Menu.
4. Click Add Columns.
5. Click OK.
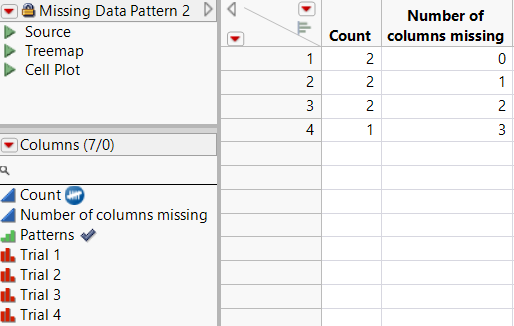
Figure 4.19 A Missing Data Pattern Table
Tip: To quickly create a Treemap or Cell Plot of the data, click the green triangle next to the Treemap or Cell Plot script in the table panel.
Figure 4.19 shows the following patterns:
• Row 1 shows that there are two instances where all rows in Trial 1, Trial 2, Trial 3, and Trial 4 have no missing values.
• Row 2 shows that there are two rows in the source table whose one missing value is in the Trial 4 column.
• Row 3 shows that there are two rows in the source table whose missing values are in the Trial 3 and Trial 4 columns.
• Row 4 shows that there is one row in the source table whose three missing values are in the Trial 2, Trial 3, and Trial 4 columns.
The Count column is assigned the frequency role. If you now use the Missing Data Pattern data table to run an analysis, JMP automatically uses Count as a frequency. See Assign a Preselected Analysis Role to a Column.

