Publication date: 11/10/2021
Life Distribution
Fit Distributions to Lifetime Data
The Life Distribution platform models time-to-event data. The platform accommodates both right-censored and interval-censored data. Use Life Distribution to do the following:
• Compare multiple distributional fits to determine which distribution best fits your data.
• Construct Bayesian fits.
• Model zero-failure data.
• Compare groups to analyze group differences.
• Analyze multiple causes of failure.
• Estimate the components of a mixture and estimate the probability that an observation comes from a given component.
• Estimate the components of a competing risk mixture and estimate the impact of a component on an observation.
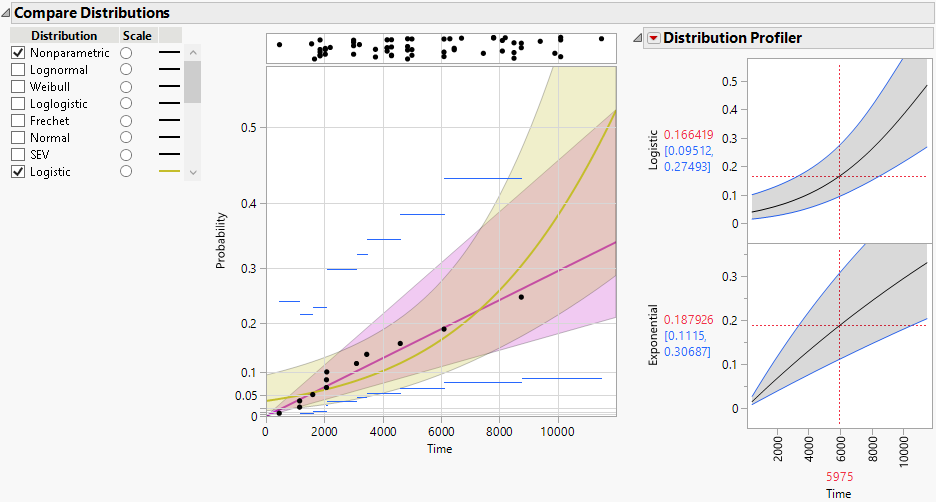
Figure 3.1 Distributional Fits and Comparisons
Contents
Overview of the Life Distribution Platform
Example of the Life Distribution Platform
Launch the Life Distribution Platform
Life Distribution Report
Event Plot
Compare Distributions
Life Distribution: Statistics
Life Distribution Report Options
Mixture
Fit Competing Risk Mixture
Weibayes Report
Competing Cause Report
Competing Cause Workflow
Competing Cause Model
Cause Combination
Competing Cause: Statistics
Individual Causes
Competing Cause Report Options
Life Distribution - Compare Groups Report
Compare Groups: Statistics
Individual Group
Life Distribution - Compare Groups Report Options
Additional Examples of the Life Distribution Platform
Omit Competing Causes
Change the Scale
Examine the Same Distribution across Groups
Weibayes Estimates
Fit Mixture Example
Fit Competing Risk Mixture Example
Statistical Details for the Life Distribution Platform
Distributions
Competing Cause Details
Notes Regarding Median Rank Regression
Want more information? Have questions? Get answers in the JMP User Community (community.jmp.com).
