 Profilers
Various profilers are provided to help you analyze the reliability properties of a system. You can view profilers for each system diagram that is listed in the Designs and the Library panels. This section describes the profilers. The profilers appear in the Profilers panel of the report.
Red Triangle Options for Profilers
Each profiler has a red triangle menu that contains the following commands:
Reset Factor Grid
Displays a window where you can enter a current setting and values that control the display. See Reset Factor Grid in Profilers for more information about setting the factor grid.
Factor Settings
Select this option to configure the profiler’s settings and to link the profilers. See Factor Settings in Profilers for more information about Factor Settings.
Note: Adjust the X and Y axes of a profiler to view the desired portion of the graph.
 Distribution Profiler
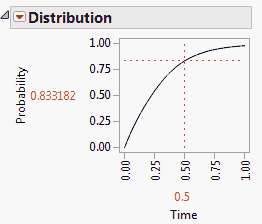
The Distribution Profiler displays the probability that the system fails as a function of time. The Distribution profiler for the system appears by default.
Figure 11.18 Distribution
 Remaining Life Distribution Profiler
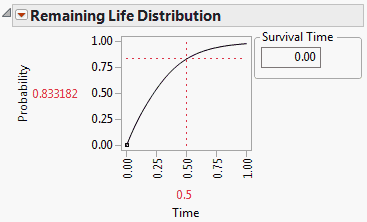
The Remaining Life Distribution profiler for the system shows the probability that the system fails given that it has survived a specified amount of time, designated as Survival Time. By default, Survival Time is set to zero, and the remaining life distribution function is equivalent to the distribution function.
Enter a value for Survival Time to indicate the time to which the system has survived without failing. As an alternative to entering a value, select the small rectangle at the origin of the graph and drag it to the right to dynamically set the Survival Time.
Figure 11.19 Remaining Life Distribution
 Reliability Profiler
The Reliability profiler for the system shows the probability that the system will function as a function of time. The reliability function is also known as the survival function.
 Quantile Profiler
The Quantile profiler for the system shows time as a function of the failure probability. Note that the Quantile function is the inverse of the Distribution function.
 Density Profiler
The Density profiler for the system shows the probability density function associated with the system’s failure distribution function.
 Hazard Profiler
The Hazard profiler for the system shows the instantaneous failure rate at a given time.
 Cumulative Hazard Profiler
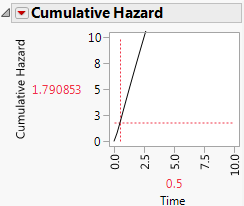
The Cumulative Hazard profiler for the system shows the cumulative hazard function as a function of time.
Figure 11.20 Cumulative Hazard


