 Example of a Covering Array with No Factor Level Restrictions
In this example, you use a covering array design to test software and operation system compatibility. You are interested in finding out which combinations of factors are likely to cause failures. There are four factors of interest:
• Web Browser (Safari, IE, Firefox, Chrome, Other)
• Operating System (Windows or macOS)
• RAM (4, 8, or 16 MB)
• Connection Speed at three settings (0-1, 1-5, or greater than 5 Mbps)
The response is whether the system functions properly for each combination of factor settings.
Testing each combination of settings would require 90 (5x2x3x3) trials. To keep the run size manageable, you decide to require Strength 3 coverage, indicating that all combinations of any three factors are tested.
Create the Design
Create the Strength 3 covering array by following these steps.
1. Select Help > Sample Data Folder and open Design Experiment/Software Factors.jmp.
The Software Factors.jmp data table contains the factors and their settings.
2. Select DOE > Special Purpose > Covering Array.
3. From the menu next to Strength: t = , select 3.
4. Click the Covering Array red triangle, select Load Factors.
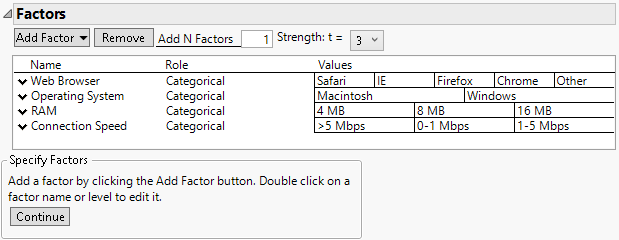
The Factors section is populated with the four factors and their levels.
Figure 21.4 Factors for Software Factors
5. Click Continue.
The Restrict Factor Level Combinations section opens, where you can enter restrictions on the design settings. Because there are no restrictions for this design, do not change the default selection of None.
6. Click Make Design.
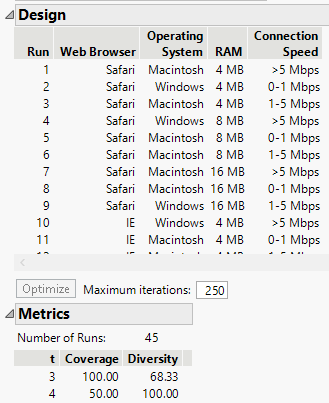
The Design section opens to show a 45-run design.
Figure 21.5 Design and Metrics for Software Factors
In the Metrics section, consider the row that corresponds to t = 3. The Coverage is 100%, indicating that the design covers 100% of the three-factor interactions. This is what you want, because you requested a Strength 3 design. For t = 3, the Diversity column indicates that 68.33% of the three-factor interactions that appear are distinct. There is some minor repetition of three-factor combinations.
For t = 4, the Coverage is 50%, indicating that the design covers half of the four-factor interactions. There are 90 possible distinct combinations of the four factor settings. The 45 runs in the design comprise one-half of these distinct combinations. The Diversity value of 100% reinforces the fact that none of the four-way interactions are repeated.
7. Click Make Table.
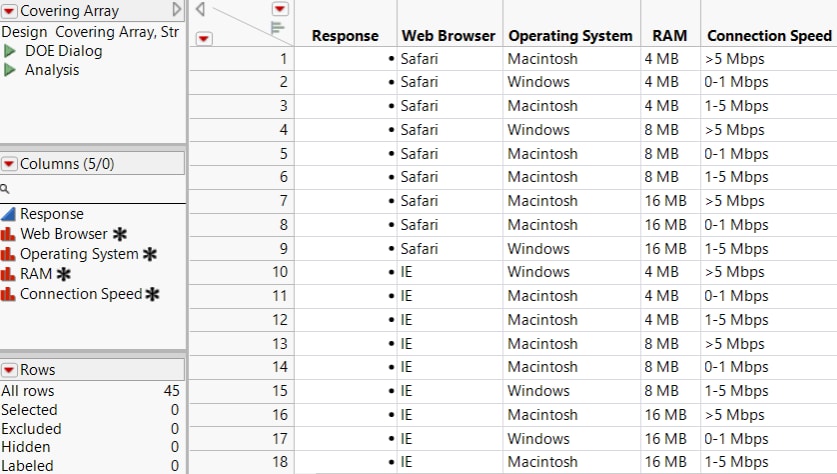
Figure 21.6 Partial Design Table for Software Factors
The design is presented in a data table. Notice the following in the Table panel at the top left:
• The Design note indicates that this is a strength 3 covering array.
• The DOE Dialog script reproduces the Covering Array window settings.
• The Analysis script analyzes the experimental data.
Analyze the Experimental Data
Now that you have your design table, you can conduct your experiment and record your data in the Response column of the design table (Figure 21.6). Your experimental results are in the Software Data.jmp sample data table.
1. Select Help > Sample Data Folder and open Design Experiment/Software Data.jmp.
2. In the Table panel, click the green triangle next to the Analysis script.
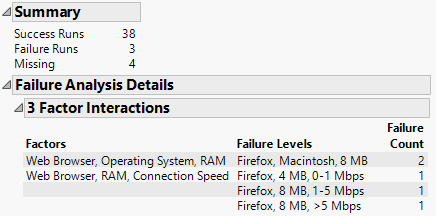
Figure 21.7 Analysis of Software Experimental Data
The Summary section indicates that three tests failed and four tests did not result in a pass or fail outcome.
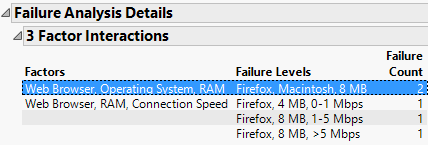
The Failure Analysis Details section gives a breakdown of failures in terms of the associated three-way interactions. The section lists only combinations of factor levels where all tests resulted in failure. If any test that involves a given three-way combination of settings results in success, then that three-way combination of settings cannot be responsible for system failure.
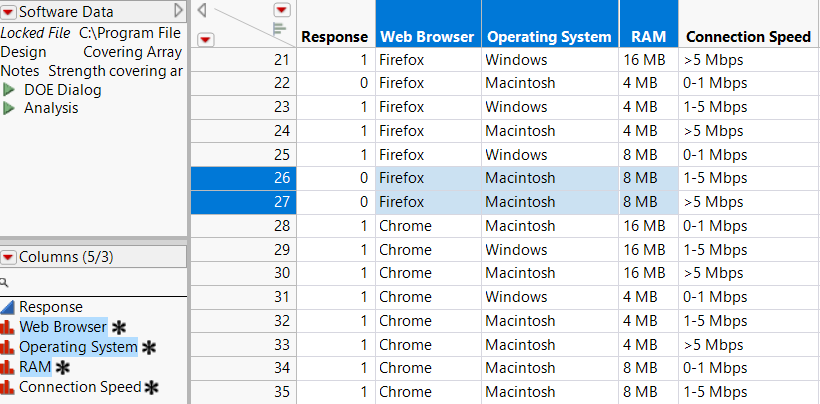
Two failures were associated with Web Browser set to Firefox, Operating System set to macOS, and RAM set to 8 MB. Notice that this combination led to failure regardless of the setting of Connection Speed.
3. Select the first line in the 3 Factor Interactions report.
Figure 21.8 Selection of an Interaction in the Analysis Report
This action selects the corresponding rows and columns in the data table.
Figure 21.9 Corresponding Selection of Rows and Columns in the Data Table
Three failures were associated with combinations of Web Browser, RAM, and Connection Speed. Note that two of these failures, Firefox, 8 MB, 1-5 Mbps and Firefox, 8 MB, >5 Mbps, are among the two failures for the Web Browser, Operating System, and RAM interaction. Selecting any of these rows in the report selects the corresponding rows and columns in the data table.
