The covering array window updates as you work through the design steps. For more information about the general flow of DOE windows, see The DOE Workflow: Describe, Specify, Design. The outlines, separated by buttons that update the outlines, follow the flow in Covering Array Flow.

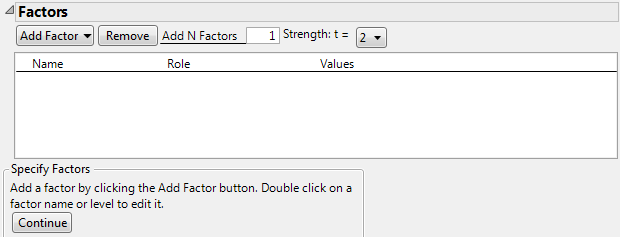
Enters the number of factors specified in Add N Factors. All factors are categorical. Select or specify the number of levels.
Adds multiple factors with a specific number of levels. Enter the number of factors to add, click Add Factor, and select or specify the number of levels. Repeat Add N Factors to add multiple factors with different numbers of levels.
Tip: When you have completed your Factors panel, select Save Factors from the red triangle menu. This saves the factor names and values in a data table that you can later reload. See Covering Array Options.
The name of the factor. When a factor is added, it is given a default name of X1, X2, and so on. To change this name, double-click it and enter the desired name.
|
•
|
To remove a factor level, click the value, click Delete, and click outside the text box.
|
|
•
|
To edit a value, click the value in the Values column.
|
For each factor, the Value Labels column property is saved to the design table. The Value Labels column property represents values in a column with specified labels. These labels are shown in the data table and are used in plots and reports. For details, see Value Labels in Column Properties.
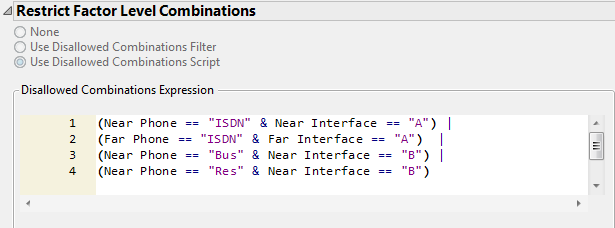
When you complete the Factors outline and click Continue, the Restrict Factor Level Combinations outline appears. This outline enables you to specify factor level combinations that are prohibited. Unless you have loaded a constraint or included one as part of a script, the None option is selected. To specify constraints, select one of the other options:
Defines sets of constraints based on restricting values of individual factors. You can define both AND and OR constraints. See Use Disallowed Combinations Filter.
Defines disallowed combinations and other constraints as Boolean JSL expressions in a script editor box. See Use Disallowed Combinations Script.
Note: The red triangle options in the Add Filter Factors menu are the same as those found in the Select Columns panel of many platform launch windows. See the Using JMP book for additional details.
To remove a single factor, select Delete from its red triangle menu.
A factor can appear in several OR groups. An occurrence of the factor in a specific OR group is referred to as an instance of the factor.
|
‒
|
Blocks Display shows each level as a block.
|
|
‒
|
List Display shows each level as a member of a list.
|
|
‒
|
Single Category Display shows each level.
|
|
‒
|
Check Box Display adds a check box next to each value.
|
Provides a text box beneath the factor name where you can enter a search string for levels of the factor. Press the Enter key or click outside the text box to perform the search. Once Find is selected, the following Find options appear in the red triangle menu:
|
‒
|
Clear Find clears the results of the Find operation and returns the panel to its original state.
|
|
‒
|
Match Case uses the case of the search string to return the correct results.
|
|
‒
|
Contains searches for values that include the search string.
|
|
‒
|
Does not contain searches for values that do not include the search string.
|
|
‒
|
Starts with searches for values that start with the search string.
|
|
‒
|
Ends with searches for values that end with the search string.
|
When creating the expression, use the name of the level in quotation marks. Do not use the ordinal value of the level. For example, Script Window Showing Names of Levels in Quotes shows the script that you entered in the phone interface example,Specify Disallowed Combinations Using a Script.
Use the Maximum iterations option to specify a maximum number of iterations to be used in optimizing the design.
|
1.
|
Select DOE > Covering Array.
|
|
2.
|
Next to Add N Factors, type 3.
|
|
3.
|
|
4.
|
Click Continue.
|
|
5.
|
Select Use Disallowed Combinations Filter.
|
|
6.
|

|
8.
|
From the Covering Array red triangle menu, select Set Random Seed.
|
|
9.
|
|
10.
|
Click Make Design.
|

A note beneath the Design outline indicates that one run has a missing setting due to the constraints. That run is run 11. To ensure that the covering array has strength 2, the combination of X1 set to L1 and X3 set to L3 is required. But for these settings, the constraints prohibit all settings for X2.
The ratio of the number of distinct t-factor settings that appear in the design to the total possible number of t-factor settings, expressed as a percent. A t-coverage of 100% indicates that all possible t-factor settings are covered by the design. Note that each t-factor setting can appear multiple times.
For constrained and unsatisfiable designs, the definition of Coverage is adjusted for the number of t-factor settings that are possible once the constraints have been applied to all t-factor combinations. See Formulas for Metrics.
The ratio of the number of distinct t-factor settings in the design to the total number of occurrences of t-factor settings in the design, expressed as a percentage. The t-diversity measures how well the design avoids replication. A t-diversity of 100% indicates that no t-factor settings are repeated. A t-diversity of 50% indicates that the average number of times that distinct t-factor settings appear is two.
For constrained and unsatisfiable designs, the definition of Diversity is adjusted for the number of runs with missing settings. See Formulas for Metrics.
Provides an analysis of your experimental data. For details, see Analysis Script. For background, see Zhang and Zhang (2011).

The Analysis script assumes the following about the Response column:
|
•
|
The Response column is continuous.
|
|
•
|
You can rename or move the Response column.
|
|
•
|
The Failure Analysis Details report contains a <k> Factor Interactions report. The value of k is the smallest number of interactions that detect a failure. (For a definition of detect, see Covering Arrays and Strength.) The three columns contain the following:
|
|
‒
|
|
‒
|
The Failure Levels column lists the values of the k factors in the Factors column that detect failures.
|
|
‒
|
The Failure Count column gives the number of failures corresponding to the k-factor combination of Failure Levels.
|
Note: A failure observation can appear in more than one of the k-factor combinations listed in the Failure Levels column.