To launch the Tabulate platform, select Analyze > Tabulate.
Switch between the two modes. Use the interactive table mode to drag and drop items, creating a custom table. Use the dialog mode to create a simple table using a fixed format. See Use the Dialog.
Lists standard statistics. Drag any statistic from the list to the table to incorporate it. See Add Statistics.
Generates separate tables for each category of a nominal or ordinal column. See Example Using a Page Column.
Enables you to change the numeric format for displaying specific statistics. See Change Numeric Formats.
(Only appears if Show Chart is selected from the red triangle menu.) Enables you to specify a uniform custom scale.
(Only appears if Show Chart is selected from the red triangle menu.) Deselect this box for each column of bars to use the scale determined separately from the data in each displayed column.
If you prefer not to drag and drop and build the table interactively, you can create a simple table using the Dialog interface. After selecting Analyze > Tabulate, select Dialog from the menu, as shown in Using the Dialog. You can make changes to the table by selecting Show Control Panel from the red triangle menu, and then drag and drop new items into the table.
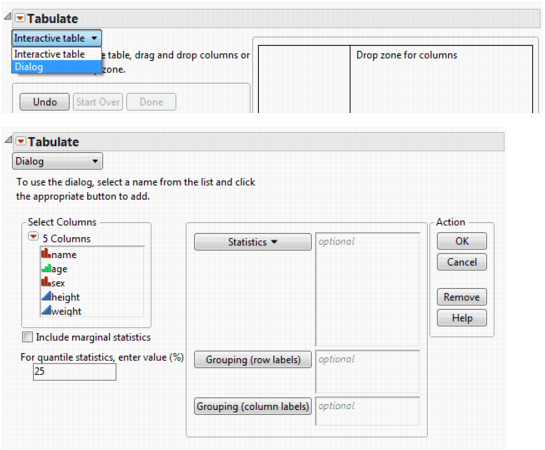
Once you’ve selected a column, select a standard statistic to apply to that column. See Add Statistics
Provides the arithmetic mean of a column’s values. It is the sum of nonmissing values (and if defined, multiplied by the weight variable) divided by the Sum Wgt.
|
‒
|
To get the percentage of the column total, drag all the grouping columns on the row table and drop them onto the % of Total heading (same as Column %). Similarly, to get the percentage of the row total, drag all grouping columns on the column table and drop them onto the % of Total heading (same as Row %).
|
Provides the sum of all values in the column. This is the default statistic for analysis columns when there are no other statistics for the table.
Provides the sum of all weight values in a column. Or, if no column is assigned the weight role, Sum Wgt is the total number of nonmissing values.
Provides the standard error of the mean. It is the standard deviation divided by the square root of N. If a column is assigned the role of weight, then the denominator is the square root of the sum of the weights.
Provides the value at which the specific percentage of the argument is less than or equal to. For example, 75% of the data is less than the 75th quantile. You can request different quantiles by clicking and dragging the Quantiles keyword into the table, and then entering the quantile into the box that appears.
|
1.
|
Click the Change Format button at the bottom of the Tabulate window.
|
|
2.
|
|
4.
|
|
5.
|
Click OK to implement the changes and close the Format section, or click Set Format to see the changes implemented without closing the Format section.
|
