For this study, the engineer wants to explore the following three inputs, which are the factors for the study:
|
•
|
Operator, who is the technician operating the welding machine
|
|
•
|
Rotation Speed, which is the speed at which the part rotates under the beam
|
|
•
|
Beam Current, which is a current that affects the intensity of the beam
|
After each processing run, the engineer cuts the part in half. This reveals an area where the two parts have fused. The Length of this fused area is the depth of penetration of the weld. This depth of penetration is the response for the study.
To begin this example, select DOE > Screening Design from the main menu. Note that in the Responses panel, there is a single default response called Y. Change the default response as follows:
|
1.
|
Double-click the response name and change it to Depth (in).
|
|
2.
|
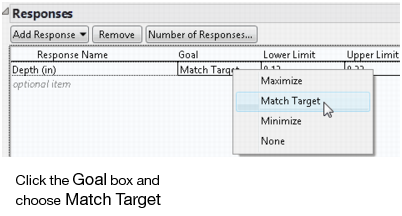
The default goal for the single default response is Maximize. But the goal of this process is to get a target value of 0.17 inches with a lower bound of 0.12 and an upper bound of 0.22. Click the Goal box and choose Match Target from the drop-down menu, as shown in Screening Design Response with Match Target Goal.
|
|
3.
|
Click the Lower Limit text edit area and enter 0.12 as the lower limit (minimum acceptable value). Then click the Upper Limit text edit area and enter 0.22 as the upper limit (maximum acceptable value).
|
This example has one categorical factor (Operator) and two continuous factors (Speed and Current). In the Factors panel:
|
4.
|
|
5.
|
|
6.
|
|
7.
|
Assign John and Mary as values for the categorical factor Operator. Set high and low values for Speed to 3 and 5 (rpm). Set high and low values for Current to 150 and 165 (amps). Your Screening Design window should appear as shown in Screening Design with Two Continuous and One Categorical Factor.
|
|
8.
|
Click Continue.
|
Since there is a standard design in the Design List for the combination of factors and levels that you have specified, the Choose Screening Type panel appears (Choose Screening Type Panel). You can choose between selecting a standard design from a list or generating an orthogonal or near-orthogonal design. Accept the default selection to Choose from a list of fractional factorial designs and click Continue.
|
9.
|
Select Full Factorial in the list of designs, as shown in List of Screening Designs for Two Continuous and One Categorical Factors, and then click Continue.
|
In the Output Options report, click the Run Order menu and select Sort Left to Right (see Output Options for Design Table). Then click Make Table to create the JMP table that contains the specified design.
The table in The Design Data Table appears. Because you have sorted the runs, they are arranged in a specific order. This has been done for expository purposes. In general, you want to randomize the rows in the data table before running your experiment.
The table uses the names for responses, factors, and levels that you specified. The Pattern variable shows the coded design runs. The table produced in this example is shown in DOE Example 1.jmp, found in the Design Experiments subfolder of the sample data folder.
The following example, adapted from Meyer, et al. (1996), demonstrates how to use JMP’s screening designer when you have many factors. In this study, a chemical engineer investigates the effects of five factors on the percent reaction of a chemical process. The factors are:
|
1.
|
Select DOE > Screening Design.
|
|
2.
|
|
3.
|
The Goal is to maximize the response, but change the minimum acceptable reaction percentage to 90 (Lower Limit), and upper limit to 99 (Upper Limit), as shown in Screening for Many Factors.
|
|
4.
|
|
5.
|
Change the default factor names (X1-X5) to Feed Rate, Catalyst, Stir Rate, Temperature, and Concentration.
|
|
7.
|
Click Continue.
|
|
8.
|
From the Choose Screening Type panel, accept the default selection to Choose from a list of fractional factorial designs.
|
Designs for the number of factors that you specified are listed in the Design List (Screening Design for Five Factors).
|
9.
|
|
10.
|
|
11.
|
To show a standard ordering for the design, select Sort Left to Right from the Run Order list.
|

|
12.
|
Click Make Table to create the data table. The design table, shown in JMP Table of Runs for Screening Example, lists the runs for the design that you selected. Note that it also inserts a column called Percent Reacted for recording experimental results. Also included are three scripts, Screening, Model, and DOE Dialog.
|
|
13.
|
|
14.
|
Click the red triangle next to the Screening script in upper left of the data table. Select Run Script. Alternatively, you can analyze the data directly by selecting Analyze > Modeling > Screening. Select Percent Reacted as Y and all other continuous variables as X.
|
|
15.
|
Click OK.
|
The report is shown in Report for Screening Example. Since the p-values are obtained using a simulation-based technique, your p-values might not precisely match those shown below.
See the section The Screening Report in The Screening Platform for a complete discussion of the screening report.
