|
•
|
|
•
|
|
•
|
|
•
|
|
•
|
Denote the n by p matrix of covariates by X, where n is the number of observations and p is the number of covariates.
|
|
•
|
For each observation in X, subtract the covariate mean and divide the difference by the pooled standard deviation for the covariate. Denote the resulting matrix by Xs.
|
The eigenvalues of the covariance matrix for Xs, namely (Xs’Xs)/(n - p), arranged in decreasing order.
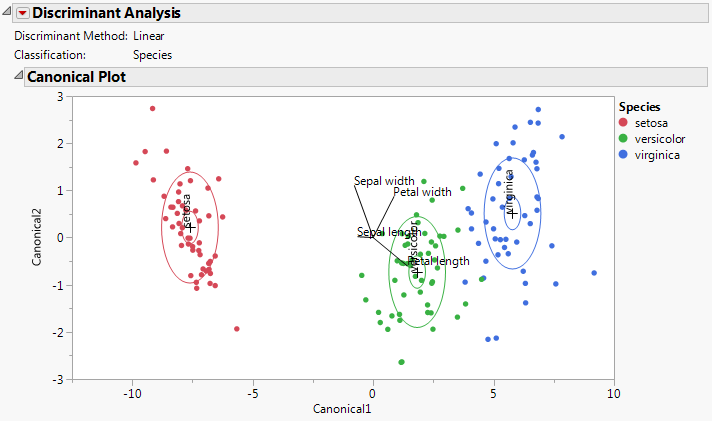
The Canonical Plot is a biplot. Canonical Plot for Iris.jmp shows the Canonical Plot for a linear discriminant analysis of the data table Iris.jmp. The points have been colored by Species.
|
•
|
Show or hide the 95% confidence ellipses by selecting Canonical Options > Show Means CL Ellipses from the red triangle menu.
|
|
•
|
Obtain the values of the loadings by selecting Canonical Options > Show Canonical Details from the red triangle menu. At the bottom of the Canonical Details report, click Standardized Scoring Coefficients. See Standardized Scoring Coefficients for details.
|
|
•
|
Show or hide the rays by selecting Canonical Options > Show Biplot Rays from the red triangle menu.
|
|
•
|
Drag the center of the biplot rays to other places in the graph. Specify their position and scaling by selecting Canonical Options > Biplot Ray Position from the red triangle menu. The default Radius Scaling shown in the Canonical Plot is 1.5, unless an adjustment is needed to make the rays visible.
|
|
•
|
Show or hide the 50% contours by selecting Canonical Options > Show Normal 50% Contours from the red triangle menu.
|
|
•
|
Color code the points to match the ellipses by selecting Canonical Options > Color Points from the red triangle menu.
|
For the Iris.jmp data, there are three Species, so only two canonical variables. The plot in Canonical Plot for Iris.jmp shows good separation of the three groups using the two canonical variables.
|
•
|
Petal length is positively associated with Canonical1 and negatively associated with Canonical2. It loads more heavily on Canonical1 than on Canonical2.
|
|
•
|
Petal width is positively associated with both Canonical1 and Canonical2. It loads more heavily on Canonical2 than on Canonical1.
|
|
•
|
Sepal width is negatively associated with Canonical1 and positively associated with Canonical2. It loads more heavily on Canonical2 than on Canonical1.
|
|
•
|
Sepal length is weakly associated with Canonical1 and very weakly associated with Canonical2.
|
Canonical Plot for Fitness.jmp shows a Canonical Plot for the sample data table Fitness.jmp. The seven continuous variates are used to classify an individual into the categories M (male) or F (female). Since the classification variable has only two categories, there is only one canonical variable.
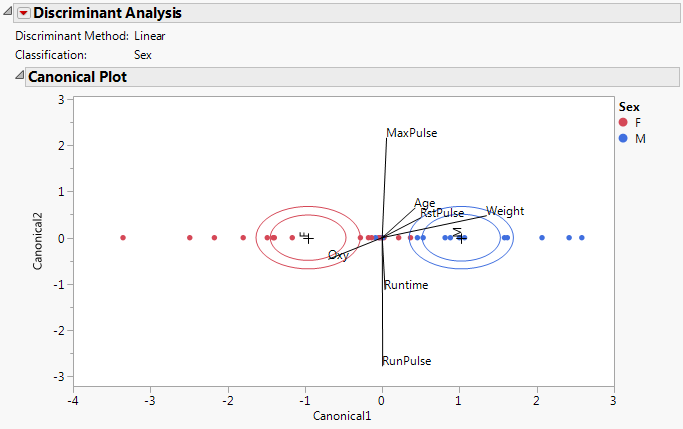
The points in Canonical Plot for Fitness.jmp have been colored by Sex. Note that the two groups are well separated by their values on Canonical1.
|
•
|
|
•
|
Weight, RstPulse, and Age are positively associated with Canonical1. Weight has the highest degree of association. The covariates RstPulse and Age have a similar, but smaller, degree of association.
|
|
•
|
Oxy is negatively associated with Canonical1.
|
Value of the saved formula SqDist[<level>] for the classification of the observation given in the data table. For details, see Score Options.
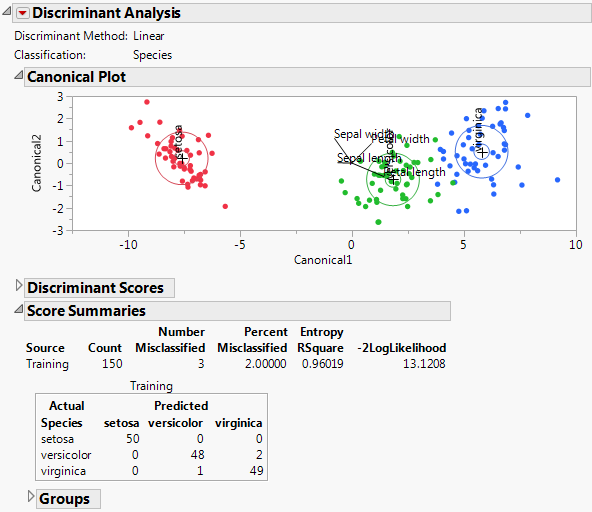
Show Interesting Rows Only shows the Discriminant Scores report for the Iris.jmp sample data table using the Linear discriminant method. The option Score Options > Show Interesting Rows Only option is selected, showing only misclassified rows or rows with predicted probabilities between 0.05 and 0.95.
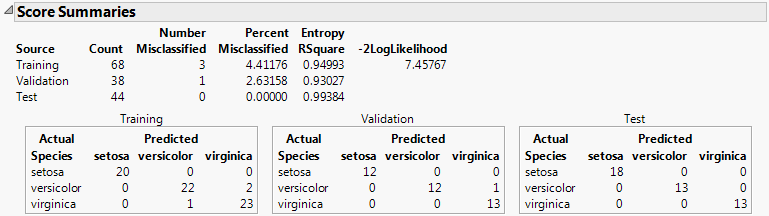
The Score Summaries report provides an overview of the discriminant scores. The table in Score Summaries for Iris.jmp shows Actual and Predicted classifications. If all observations are correctly classified, the off-diagonal counts are zero.
If you used Stepwise Variable Selection to construct the model, the columns entered into the model are listed. See Score Summaries Report Showing Selected Covariates.
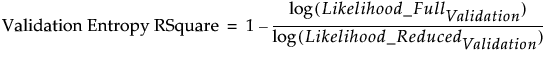
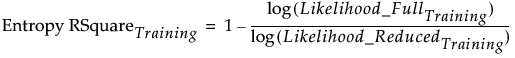
Twice the negative log-likelihood of the observations in the training set, based on the model. Larger values indicate better fit. Provided for the training set only. For more details, see Fitting Linear Models.
Shows matrices of actual by predicted counts for each level of the categorical X. If you are using JMP Pro with validation, a matrix is given for each set of observations. If you are using JMP with excluded rows, the excluded rows are considered the validation set and a separate Validation matrix is given. For more information, see Validation in JMP and JMP Pro.
|
•
|
|
•
|
|
•
|
|
•
|