Quality Tools for Process Improvement Methodologies

What are the first two Laws of Analytics? According to many experts, they are all about visualizing data. JMP has an incredibly powerful graphical analysis capability called Graph Builder. Join us as we discuss the fantastic capabilities of this easy-to-use, world-class data visualization tool.

These fun, interactive sessions are designed to accelerate your data journey to better business decisions and results. Each session is 30 minutes long.

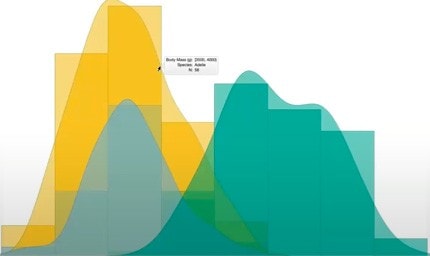
Session 1: The First Law of Analytics: Graph Your Data

If you're new to JMP, Graph Builder is one of the absolute best places to get started with the software. No matter your area of study or what kind of data you are working with, you'll probably have to visualize your data at some point. And, let's be honest, it should be the first thing you do after getting your data loaded, no matter what. In this session, we will briefly tour JMP's Graph Builder tool and give you our favorite tips for supercharging your Graph Builder session.

Session 2: The First Law of Analytics, Continued: Graph Your Data with Maps

Graph Builder has a fantastic hidden feature — it can work with maps and geographic data. This can be anything from plotting coordinates on a map to showing locations inside buildings or even inside instruments. You just need to know a few tricks to do it. During this session, we will show you how to work with Graph Builde r's geographic capabilities and some of the interesting analytical possibilities that come from working with this data.

Session 3: The Second Law of Analytics: Explore (or Screen) Your Data Graphically

Sometimes you don’t know where to start with a new data set. Sometimes you need help communicating a result and or understanding an impact. In these cases, our expert reaches for his favorite screening tool — Graph Builder. In this final session, you will see how to transform JMP's Graph Builder into a powerful screening tool with just a few mouse clicks.


About the Series

The JMP Beyond Spreadsheets program consists of three parts, with multiple sessions in each part. The lineup includes:

Part I: Breaking Away from Spreadsheets

Part II: Graph Builder: The Two Laws of Analytics

Part III: Better Communication with Dashboards - Coming Soon!

Register now for this free webinar

*
*
*
*
*
  Please subscribe me to JMP Newswire, the monthly newsletter for JMP users.
  Yes, you may send me emails occasionally about JMP products and services. I understand that I can withdraw my consent at any time by clicking the opt-out link in the emails.

JMP Statistical Discovery LLC. Your information will be handled in accordance with our Privacy Statement.