Adverse Events Incidence Rates
This report screens all adverse eventsand tabulates the number of occurrences of each event and calculates their incidence rates. On treatment events and incidence rates are calculated using TRTSDTM and TRTEDTM.
Report Results Section
Running Adverse Events Incidence Rates report using the Nicardipine sample data for risk differences generates the report shown below.
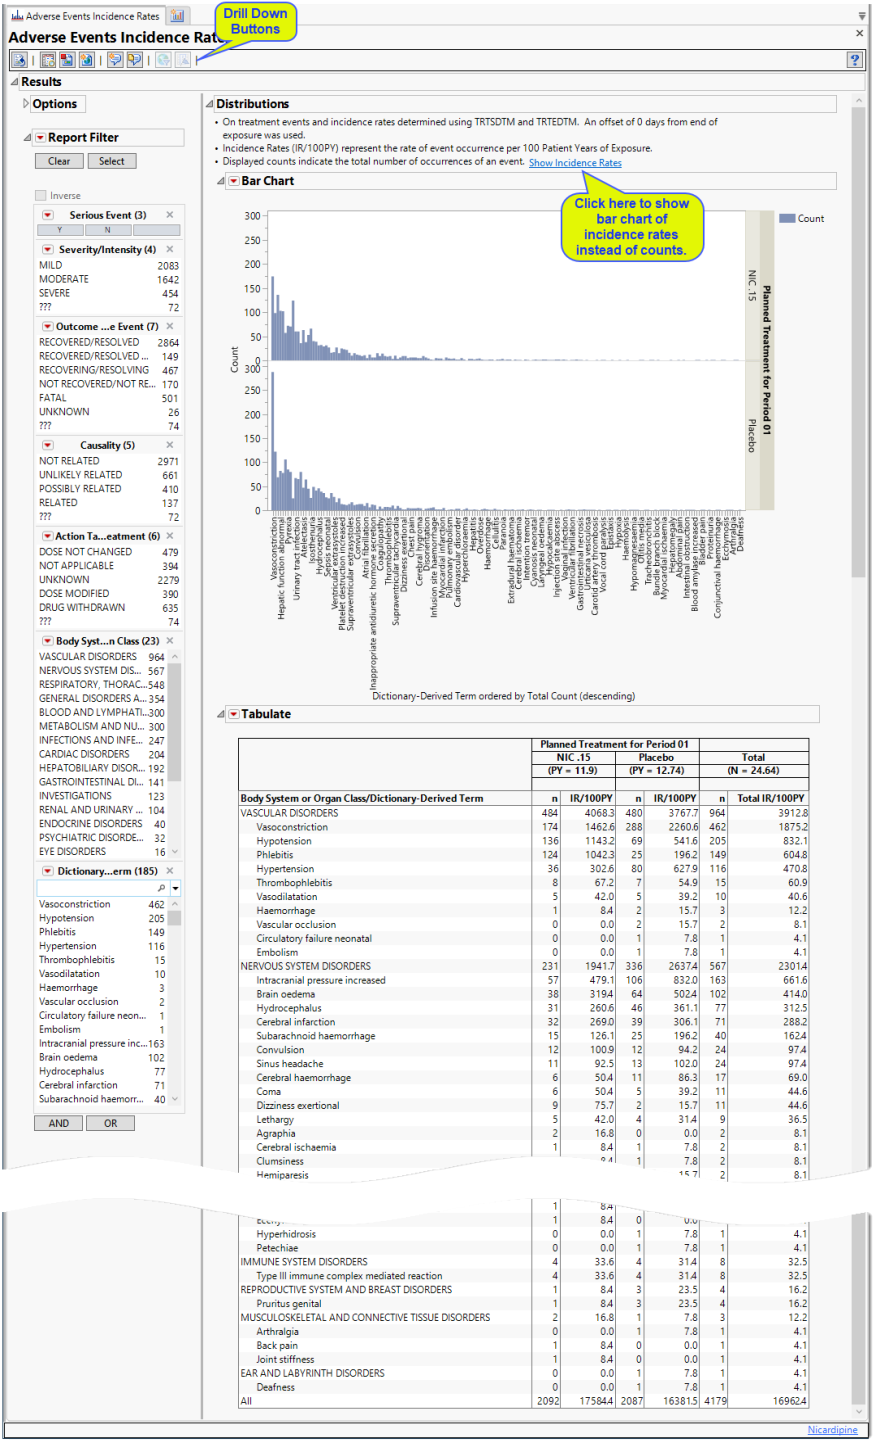
The Report contains the following elements:
Bar Chart
One Bar Chart showing the number of occurrences of each adverse event, by treatment arm, over the course of the study.
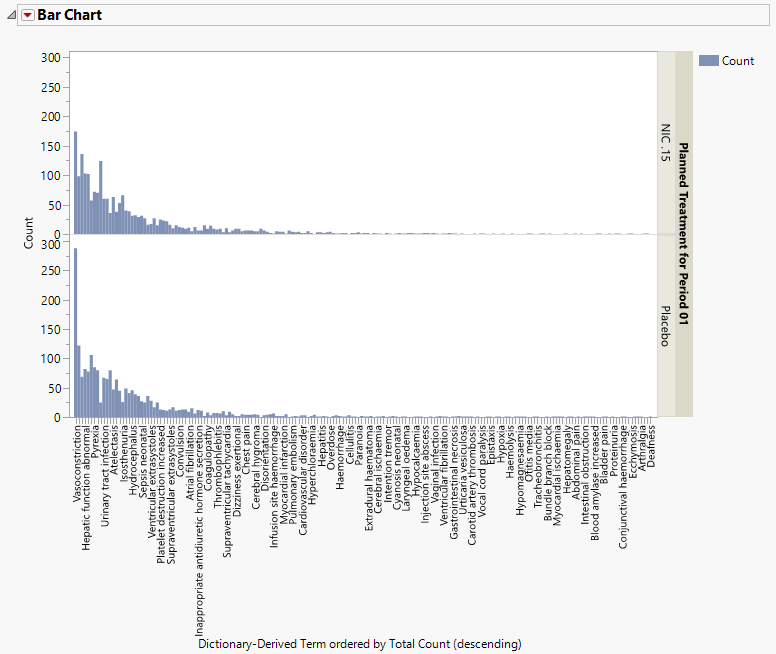
Displayed counts indicate the total number of new occurrences of an event. They can include one-time or multiple occurrences per patient.
Note: You can opt to display incidence rates instead of counts, for the adverse events.
Tabulate
The table presents an alternate view, listing the subject counts experiencing an event and the respective incidence rates of subjects (in parentheses) on each treatment arm.
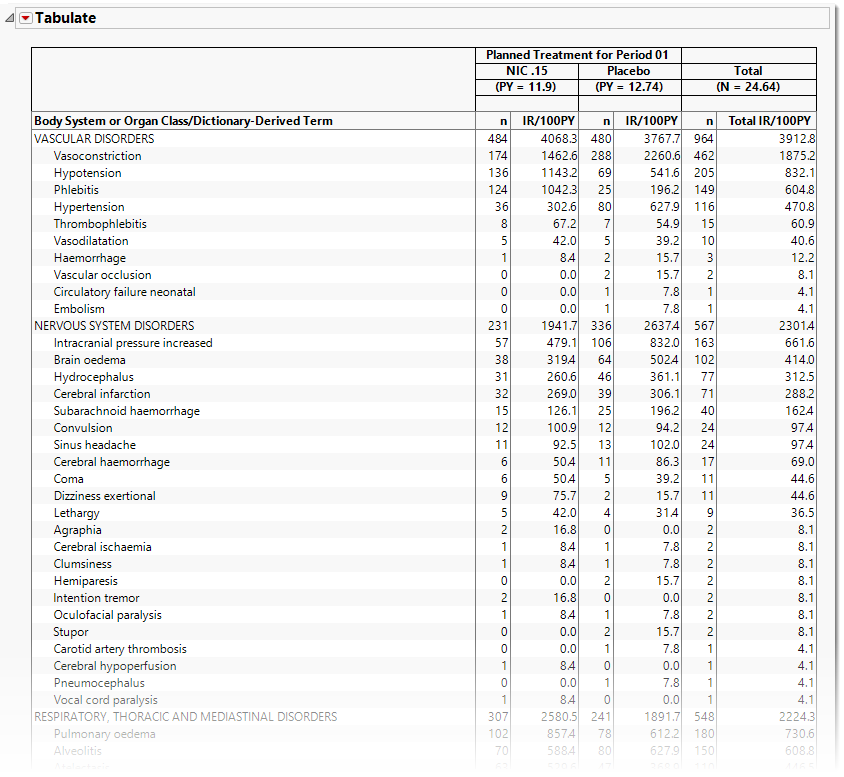
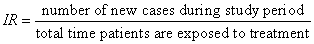
Incidence rates (IR/100PY) represent the rate of new event occurrences per 100 patient years of exposure to the treatment drug(s) or placebo.
Report Data Filters
These filters enable you to subset and view subjects based on demographic characteristics and other criteria. Refer to Data Filter for more information.
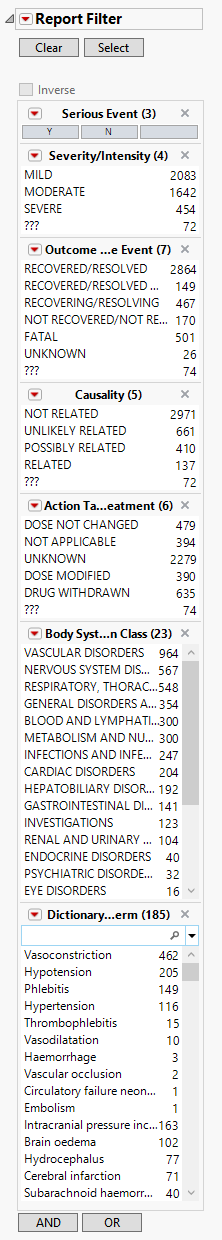
Note: Filter specifications are reapplied when any widget options are changed.
Options
Use the widgets on this panel to customize your analysis.
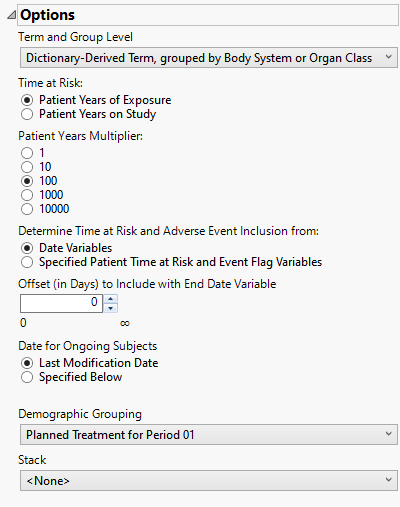
Term and Group Levels
Term and Group Levels are determined by the coding dictionary for the Event or Intervention domain of interest, typically these levels follow the MedDRA dictionary. You must indicate how each adverse event is named and the level at which the event is considered. For example, selecting Reported Term and Body System or Organ Class as theTerm and Group Level, respectively, reports the event specified by the actual event term as reported in the AE domain on the affected organ or body system.
Time at Risk
Use this widget to specify how to calculate each patients duration in patient years. Refer to Time at Risk: for more information.
Patient Years Multiplier
Use this widget to select a multiplier for incidence rates for better interpretability and comparison among studies. Refer to Patient Years Multiplier: for more information.
Determine Time at Risk and Adverse Event Inclusion from:
Use this option to specify whether JMP Clinical should calculate patient years and event inclusion based on study date variables or from derived patient years/time at risk and event inclusion flags. Refer to Determine Time at Risk and Adverse Event inclusion from: for more information.
Offset (in days) to Include with End Date Variable
Use this option to specify the number of days after the last date of study or exposure for calculation of patient time at risk and adverse event variable inclusion. Refer to Offset (in Days) to Include with End Date Variable for more information.
Date for Ongoing Subjects
Use this widget to specify an end date for subjects that are continuing in the clinical trial. Refer to Date for Ongoing Subjects for more information.
Demographic Grouping and Stacked
Results can be viewed as a whole or they can either be split out by Demographic Grouping or Stacked to show different levels within each event. Demographic Grouping changes the variable displayed on the Y axis of the bar chart, as well as change the variable used across the top of the table to split the columns. Stack impacts only the bar chart by stacking the bars according to the levels of the chosen variable. For example, if severity is chosen, the bars are stacked by mild, moderate, and severe events.
General and Drill Down Buttons
Action buttons, provide you with an easy way to drill down into your data. The following action buttons are generated by this report:
| • | Click  to rerun the report using default settings. to rerun the report using default settings. |
| • | Click  to view the associated data tables. Refer to Show Tables/View Data for more information. to view the associated data tables. Refer to Show Tables/View Data for more information. |
| • | Click  to generate a standardized pdf- or rtf-formatted report containing the plots and charts of selected sections. to generate a standardized pdf- or rtf-formatted report containing the plots and charts of selected sections. |
| • | Click  to generate a JMP Live report. Refer to Create Live Report for more information. to generate a JMP Live report. Refer to Create Live Report for more information. |
| • | Click  to take notes, and store them in a central location. Refer to Add Notes for more information. to take notes, and store them in a central location. Refer to Add Notes for more information. |
| • | Click  to read user-generated notes. Refer to View Notes for more information. to read user-generated notes. Refer to View Notes for more information. |
Default Settings
Refer to Set Study Preferences for default Subject Level settings.
Methodology
Patients are assessed for each adverse event they experience. The number of occurrences of each event is calculated and used to calculate incidence rates using the following formula:
A case is considered new if the patient first developed symptoms after the start of the trial. Adverse events occurring after a patient has recovered from a prior occurrence are considered new cases. Exposure time is normally considered to be total study time unless a patient discontinues or an offset is specified or a specific At Risk time or event flag is specified.