Constant Findings
This report identifies tests from findings domains (LB, EG, or VS) that have the same result for the entire study.
Report Results Description
Running Constant Findings for Nicardipine using default settings generates the report shown below.
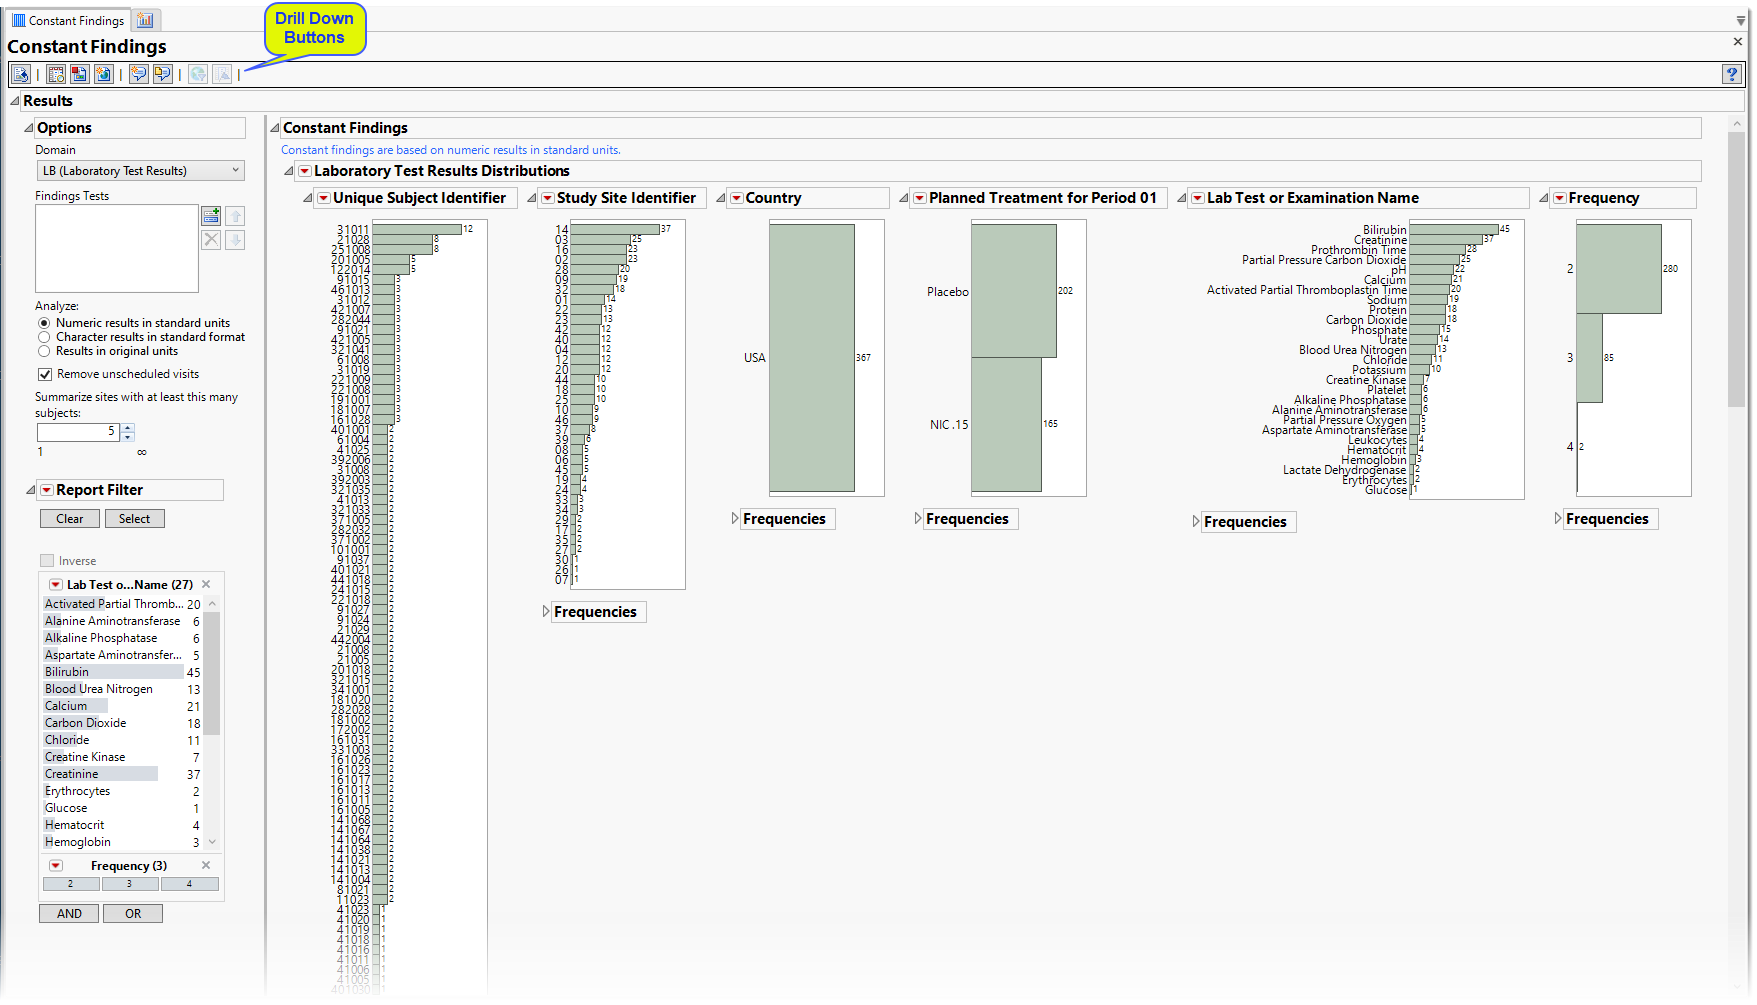
The Report contains the following elements:
Test Results
Multiple sections, one for each findings domain, that contain the variable specified by the Analyze: option. Data that are summarized are those test codes that are constant throughout the course of the study. One example is the Lab Test Results section
.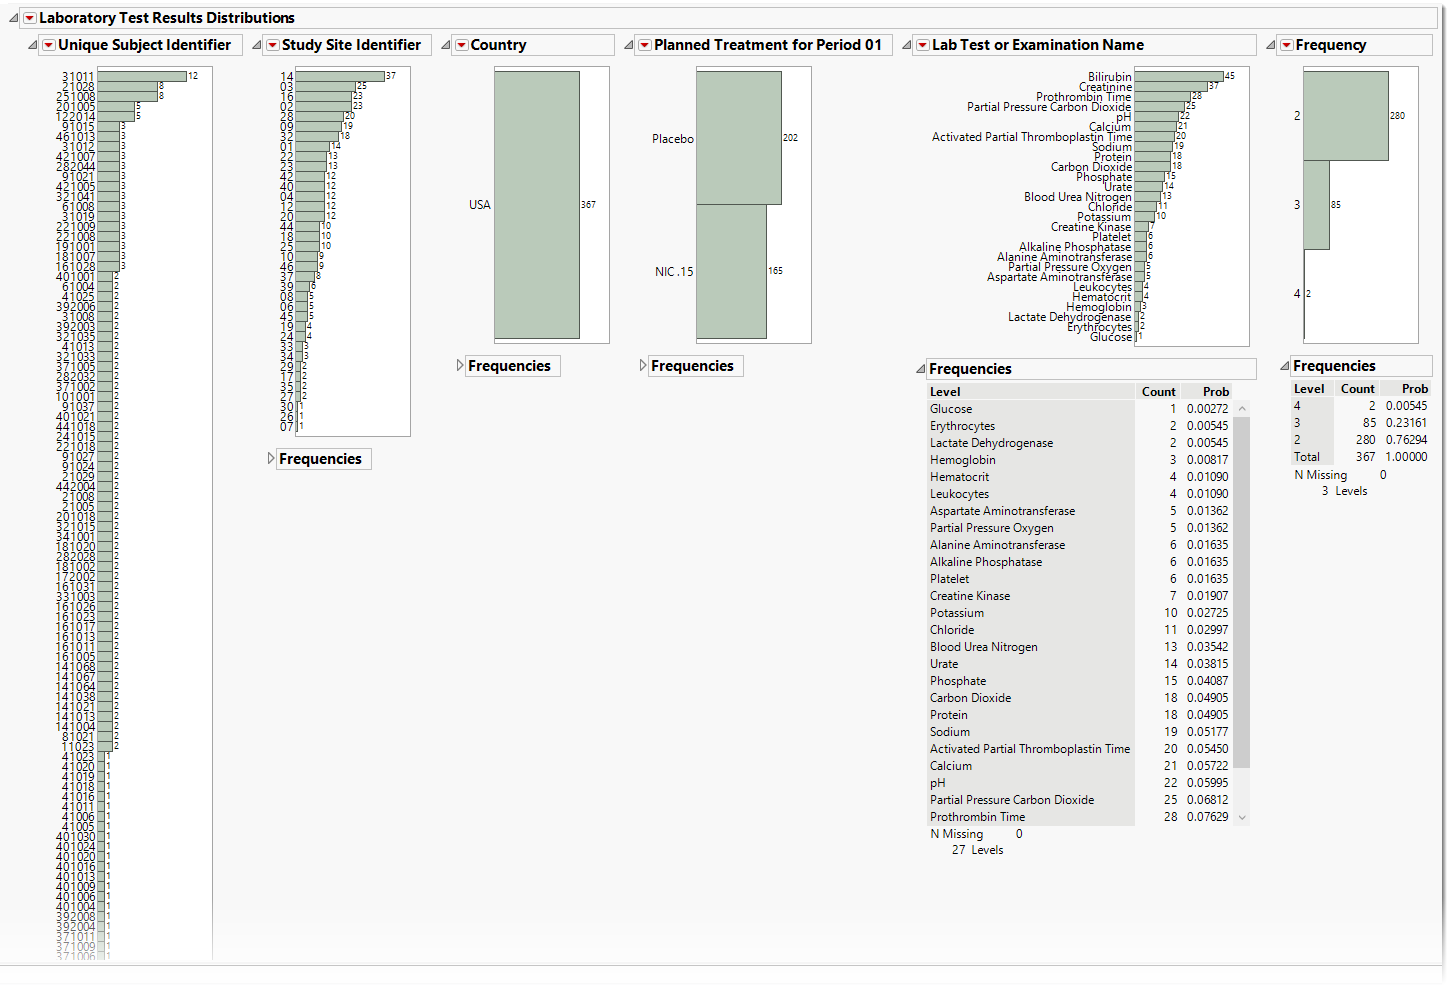
The Lab Test Results section contains the following elements:
| • | One or more Histograms. |
The data table underlying these histograms represent tests that are constant for the duration of the trial. Therefore, Unique Subject Identifier summarizes the number of Lab tests that are constant for each subject. Study Site Identifier shows the frequency of constant tests at each study site. Country summarizes the country of the study site subjects participated at. Test or Examination Name shows the tests that are constant. Treatment Arm is provided to show whether the frequency of constant tests varies based on study treatment.
See Distribution for more information.
Click the  general button to show the records for selected subjects. This details the tests that are constant, as well as the value and the number of times each value is repeated.
| • | Frequency Tables |
There is a table for each bar chart listing the frequencies and probabilities for observing constant findings.
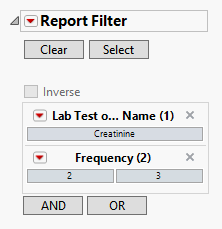
Report Filter
These filters enable you to subset and view subjects based on demographic characteristics and other criteria. Refer to Data Filter for more information.
Options
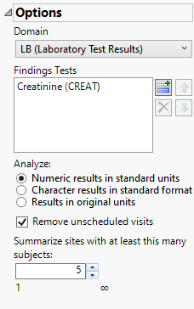
Domain
Use this widget to specify whether to plot the distribution of measurements from either the Electrocardiogram (EG), Laboratory (LB), or Vital Signs (VS) findings domains.
Findings Tests
Use this widget to select Findings Tests for the analysis. The report will autorun and analysis is restricted to the selected tests only.
Analyze:
You can specify whether to search all results in original units when you Analyze: the data or restrict the search to either character results (in standard format) or numeric results (in standard units).
Remove unscheduled visits
You might or might not want to include unscheduled visits when you are analyzing findings by visit. Check the Remove unscheduled visits to exclude unscheduled visits.
Summarize sites with at least this many subjects:
The Summarize sites with at least this many subjects: widget enables you to set a minimal threshold for the sites to be analyzed. Only those sites which exceed the specified number of subjects are included. This feature is useful because it enables you to exclude smaller sites, where small differences due to random events are more likely to appear more significant than they truly are. In larger sites, observed differences from expected attendance due to random events are more likely to be significant because any deviations due to random events are less likely to be observed.
General and Drill Down Buttons
Action buttons, provide you with an easy way to drill down into your data. The following action buttons are generated by this report:
| • | Click  to rerun the report using default settings. to rerun the report using default settings. |
| • | Click  to view the associated data tables. Refer to Show Tables/View Data for more information. to view the associated data tables. Refer to Show Tables/View Data for more information. |
| • | Click  to generate a standardized pdf- or rtf-formatted report containing the plots and charts of selected sections. to generate a standardized pdf- or rtf-formatted report containing the plots and charts of selected sections. |
| • | Click  to generate a JMP Live report. Refer to Create Live Report for more information. to generate a JMP Live report. Refer to Create Live Report for more information. |
| • | Click  to take notes, and store them in a central location. Refer to Add Notes for more information. to take notes, and store them in a central location. Refer to Add Notes for more information. |
| • | Click  to read user-generated notes. Refer to View Notes for more information. to read user-generated notes. Refer to View Notes for more information. |
| • | Click  to open and view the Subject Explorer/Review Subject Filter. to open and view the Subject Explorer/Review Subject Filter. |
| • | Click  to specify Derived Population Flags that enable you to divided the subject population into two distinct groups based on whether they meet very specific criteria. to specify Derived Population Flags that enable you to divided the subject population into two distinct groups based on whether they meet very specific criteria. |
Default Settings
Refer to Set Study Preferences for default Subject Level settings.
Methodology
No testing is performed. Analysis is restricted to tabulating counts/frequencies of subjects exhibiting constant findings results.