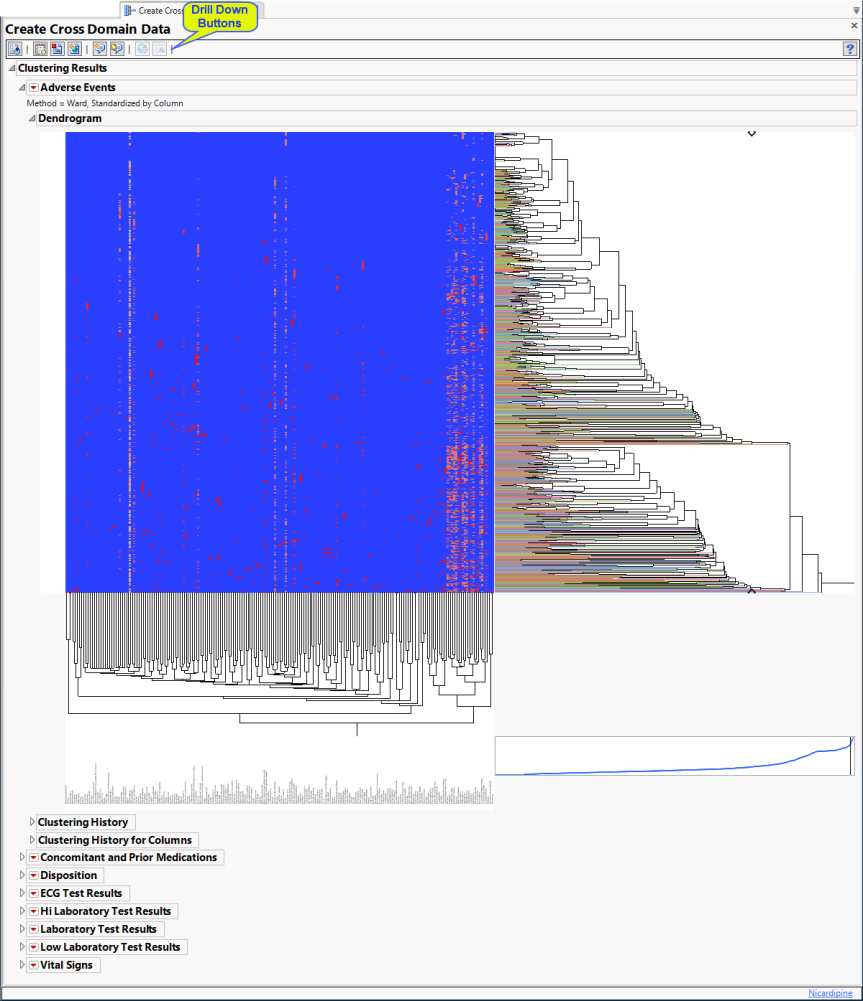
Create Cross Domain Data
This report creates indicator variables from various domains and appends to the ADSL table to create a new cross domain data table. Indicator variables are generated from interventions domains (e.g. CM, SU), events domains (e.g AE, MH, CE), binary variables in ADSL, character findings (e.g. VSSTRESC in VS domain) and high and low laboratory tests (LBTESTCD in LB domain). The report converts all character variables with values N and Y to numeric variables with values 0 and 1, respectively. The resulting output data set is suitable for pattern discovery and predictive modeling. A transposed version of the data set is also produced. Both versions are useful for clustering.
Report Results Description
Running this report with the Nicardipine sample setting generates the Results shown below. Output from the report is organized into sections. Each section contains one or more plots, data panels, data filters, or other elements that facilitate your analysis.
Hierarchically clusters all binary indicator variables. A separate section is created for each domain (Adverse Events (AE), Concomitant and Prior Medications (CM and MH), Disposition (DS), Electrocardiogram (ECG), Hi and Low Laboratory Results (LB), and selected Vital Signs (VS)) that has binary variables, depending on the options selected. The binary variables are converted to 0s and 1s and clustered.
The AE Indicators section is shown below:
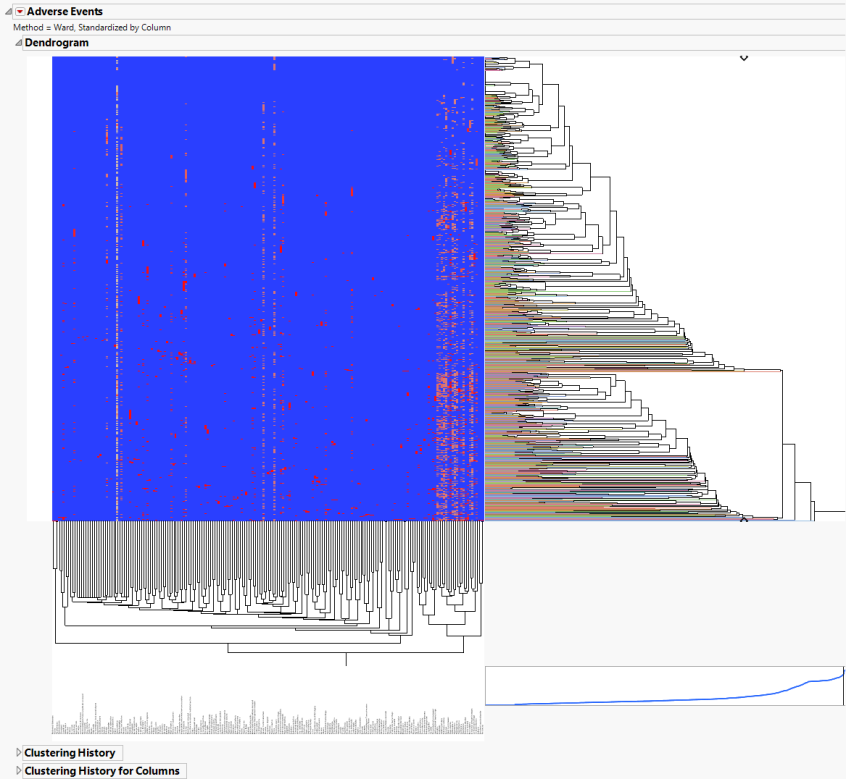
An Indicator section contains the following elements:
| • | A two-way hierarchical clustering analysis of the 0-1 variables, with subjects as rows and indicator variables as columns. |
You can study the Heat Map and Dendrogram to see both subjects that have similar values of the binary variables as well as binary variables that are similar across subjects.
See the JMP Hierarchical Clustering platform for more information.
General and Drill Down Buttons
Action buttons, provide you with an easy way to drill down into your data. The following action buttons are generated by this report:
| • | Click  to rerun the report using default settings. to rerun the report using default settings. |
| • | Click  to view the associated data tables. Refer to Show Tables/View Data for more information. to view the associated data tables. Refer to Show Tables/View Data for more information. |
| • | Click  to generate a standardized pdf- or rtf-formatted report containing the plots and charts of selected sections. to generate a standardized pdf- or rtf-formatted report containing the plots and charts of selected sections. |
| • | Click  to generate a JMP Live report. Refer to Create Live Report for more information. to generate a JMP Live report. Refer to Create Live Report for more information. |
| • | Click  to take notes, and store them in a central location. Refer to Add Notes for more information. to take notes, and store them in a central location. Refer to Add Notes for more information. |
| • | Click  to read user-generated notes. Refer to View Notes for more information. to read user-generated notes. Refer to View Notes for more information. |
| • | Click  to open and view the Subject Explorer/Review Subject Filter. to open and view the Subject Explorer/Review Subject Filter. |
| • | Click  to specify Derived Population Flags that enable you to divided the subject population into two distinct groups based on whether they meet very specific criteria. to specify Derived Population Flags that enable you to divided the subject population into two distinct groups based on whether they meet very specific criteria. |
Note: For information about how treatment emergent adverse events (TEAEs) are defined in JMP Clinical, please refer to How does JMP Clinical determine whether an Event Is a Treatment Emergent Adverse Event?.
Default Settings
Refer to Set Study Preferences for default Subject Level settings.
Methodology
**Need Verbiage here.