DSUR/PSUR Report
The DSUR/PSUR Report is used to generate a report for updating regulatory agencies regarding the safety of a clinical trial design and execution for the purpose of securing permission for the continuance of the trial..
Report Results Description
Running DSUR/PSUR Report for the Nicardipine study using default settings, generates the Report shown below.

The Report contains the following elements:
Demographics and Baseline Characteristics
The tables in this section (shown below) summarize demographic information about the subjects in this study. Both count and percentile data are provided by treatment arm.

Disposition of Subjects
The tables in this section (shown below) summarize disposition information about the subjects in this study. Both count and percentile data are provided for each disposition event broken out by treatment arm.

The order of variables selected to use for Randomization of the disposition table order is as follows: first RANDFL, then RAND, then RANDOMIZED, then either RANDOM, or RANDDT in ADSL or DM. If none of those variables exist, look in DS for records where DSDECOD=RANDOMIZED.
Exposure
The tables in this section (shown below) summarize length of exposure by treatment arm. Treatment administration methods are also summarized.

Adverse Events
The tables in this section (shown below) summarize adverse events experience by subjects in this study. Both count and percentile data are provided by treatment arm.

Serious Adverse Events
The tables in this section (shown below) summarize serious adverse events experience by subjects in this study. Both count and percentile data are provided by treatment arm.

Options
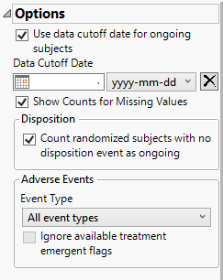
Use data cutoff date for ongoing subjects
For subjects who are ongoing in the study, it is useful for indicating the date on which the data for this update report was pulled, particularly when considering exposure data. The Use data cutoff date for ongoing subjects and Data Cutoff Date widgets enable you to specify and use a data cutoff date for reporting on ongoing subjects.
Check this box to use the date on which the study data was pulled for this report in place of exposure end date for ongoing subjects.
Data Cutoff Date
For subjects who are ongoing in the study, it is useful for indicating the date on which the data for this update report was pulled, particularly when considering exposure data. The Use data cutoff date for ongoing subjects and Data Cutoff Date widgets enable you to specify and use a data cutoff date for reporting on ongoing subjects.
Use this widget to specify the date on which the study data was pulled for this report.
Show Counts for Missing Values
Checking the Show Counts for Missing Values widget adds a row to the summary statistic tables to report the number of missing records.
Count randomized subjects with no disposition event as ongoing
Check this box to count subjects who do not have a record in DS for either Completed or Discontinued as Ongoing for treatment and study status. Refer to to Count randomized subjects with no disposition events as ongoing for more information.
Event Type
Analysis can consider all events or only those that emerge at specific times before, during, or after the trial period. For example, selecting On treatment events as the Event Type includes only those events that occur on or after the first dose of study drug and at or before the last dose of drug (+ the offset for end of dosing).
Ignore available treatment emergent flags
If you choose to Ignore available treatment emergent flags, the analysis includes all adverse events that occur on or after day 1 of the study when the event type is Treatment emergent events.
General and Drill Down Buttons
Action buttons, provide you with an easy way to drill down into your data. The following action buttons are generated by this report:
| • | Click  to rerun the report using default settings. to rerun the report using default settings. |
| • | Click  to view the associated data tables. Refer to Show Tables/View Data for more information. to view the associated data tables. Refer to Show Tables/View Data for more information. |
| • | Click  to generate a standardized pdf- or rtf-formatted report containing the plots and charts of selected sections. to generate a standardized pdf- or rtf-formatted report containing the plots and charts of selected sections. |
| • | Click  to generate a JMP Live report. Refer to Create Live Report for more information. to generate a JMP Live report. Refer to Create Live Report for more information. |
| • | Click  to take notes, and store them in a central location. Refer to Add Notes for more information. to take notes, and store them in a central location. Refer to Add Notes for more information. |
| • | Click  to read user-generated notes. Refer to View Notes for more information. to read user-generated notes. Refer to View Notes for more information. |
| • | Click  to open and view the Subject Explorer/Review Subject Filter. to open and view the Subject Explorer/Review Subject Filter. |
| • | Click  to specify Derived Population Flags that enable you to divided the subject population into two distinct groups based on whether they meet very specific criteria. to specify Derived Population Flags that enable you to divided the subject population into two distinct groups based on whether they meet very specific criteria. |
Default Settings
Refer to Set Study Preferences for default Subject Level settings.
Methodology
No testing is performed. Analysis is restricted to tabulating counts/percentages of subjects' demographics, dispositions, and exposure, and the adverse events they experienced.