Findings Box Plots
This report displays the box plots by treatment group representing the change from baseline in measurements for each test for specified findings domain across various times or points in the study. Times can be specified using a list of bracketed times or, alternatively, a number of times can be set to create times that span across the entire study.
If the variable xxBLCHG (where xx is substituted with the chosen domain 2 letter code) exists, this variable is used in plotting change from baseline. Otherwise, a measurement is determined to be a baseline measurement by the ABLFL or xxBLFL variable where xx is substituted with the 2-letter code for the chosen domain for analysis. If this variable does not exist, baseline is calculated from measurements taken on or before day 1 of the study. A time can be specified to determine baseline measurements.
Note: JMP Clinical uses a special protocol for data including non-unique Findings test names. Refer to How does JMP Clinical handle non-unique Findings test names? for more information.
Report Results Description
Running Findings Box Plots for Nicardipine using default settings generates the report shown below. Output from the report is organized into sections. Each section contains one or more plots, data panels, data filters, or other elements that facilitate your analysis.
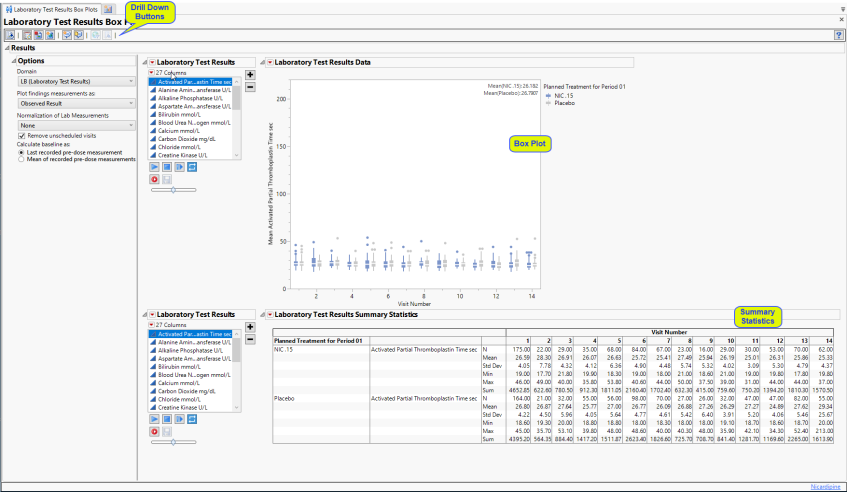
LB Box Plots
Presents a Box Plot displaying values chosen in the Plot findings measurements as: option. The name of this section varies based on the domain chosen.
Note: The name of this section and the findings results (LB, VS, or EG) displayed depend on the domain selected using the Domain option.
It contains one or more set of Box Plots with a box for each treatment.
Each box plot set represents an xxTESTCD from the selected domain. For example, in the graph above, the first figure represents the change from baseline for APTT (Activated Partial Thromboplastin Time) at each visit for both treatment arms. The table presents the associated statistics.
Use the drop down menu to the left of the plots to select the findings test results to display
Options
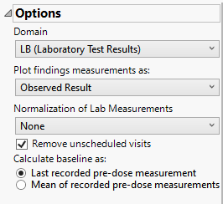
Domain
Use this widget to specify whether to plot the distribution of measurements from either the Electrocardiogram (EG), Laboratory (LB), or Vital Signs (VS) findings domains.
Plot findings measurements as:
Use this widget to specify whether to plot the results either as observed or how they relate to the baseline measurement. Refer to Plot findings measurements as: for more information.
Normalization of Lab Measurements
Use this widget to select a normalization to be applied to the baseline and on-therapy measurements. Refer to Normalization of Lab Measurements for more information.
Remove unscheduled visits
You might or might not want to include unscheduled visits when you are analyzing findings by visit. Check the Remove unscheduled visits to exclude unscheduled visits.
Calculate baseline as:
Use the Calculate baseline as: widget to use the last recorded pre-dose measurement or the mean of all the measurements taken during the baseline time window as the baseline measurement.
General and Drill Down Buttons
Action buttons, provide you with an easy way to drill down into your data. The following action buttons are generated by this report:
| • | Click  to rerun the report using default settings. to rerun the report using default settings. |
| • | Click  to view the associated data tables. Refer to Show Tables/View Data for more information. to view the associated data tables. Refer to Show Tables/View Data for more information. |
| • | Click  to generate a standardized pdf- or rtf-formatted report containing the plots and charts of selected sections. to generate a standardized pdf- or rtf-formatted report containing the plots and charts of selected sections. |
| • | Click  to generate a JMP Live report. Refer to Create Live Report for more information. to generate a JMP Live report. Refer to Create Live Report for more information. |
| • | Click  to take notes, and store them in a central location. Refer to Add Notes for more information. to take notes, and store them in a central location. Refer to Add Notes for more information. |
| • | Click  to read user-generated notes. Refer to View Notes for more information. to read user-generated notes. Refer to View Notes for more information. |
| • | Click  to open and view the Subject Explorer/Review Subject Filter. to open and view the Subject Explorer/Review Subject Filter. |
| • | Click  to specify Derived Population Flags that enable you to divided the subject population into two distinct groups based on whether they meet very specific criteria. to specify Derived Population Flags that enable you to divided the subject population into two distinct groups based on whether they meet very specific criteria. |
Default Settings
Refer to Set Study Preferences for default Subject Level settings.
Methodology
No testing is performed. Analysis is restricted to tabulating counts/frequencies of subjects exhibiting constant findings results.