Interventions Distribution
This report compares distributions of interventions (either concomitant medication or substance use) and demographic variables across treatment arms.
Note: Refer to Distribution Reports for a description of the general analysis performed by the JMP Clinical distribution reports.
Report Results Description
Running this report for Nicardipine using default settings generates the report shown below.
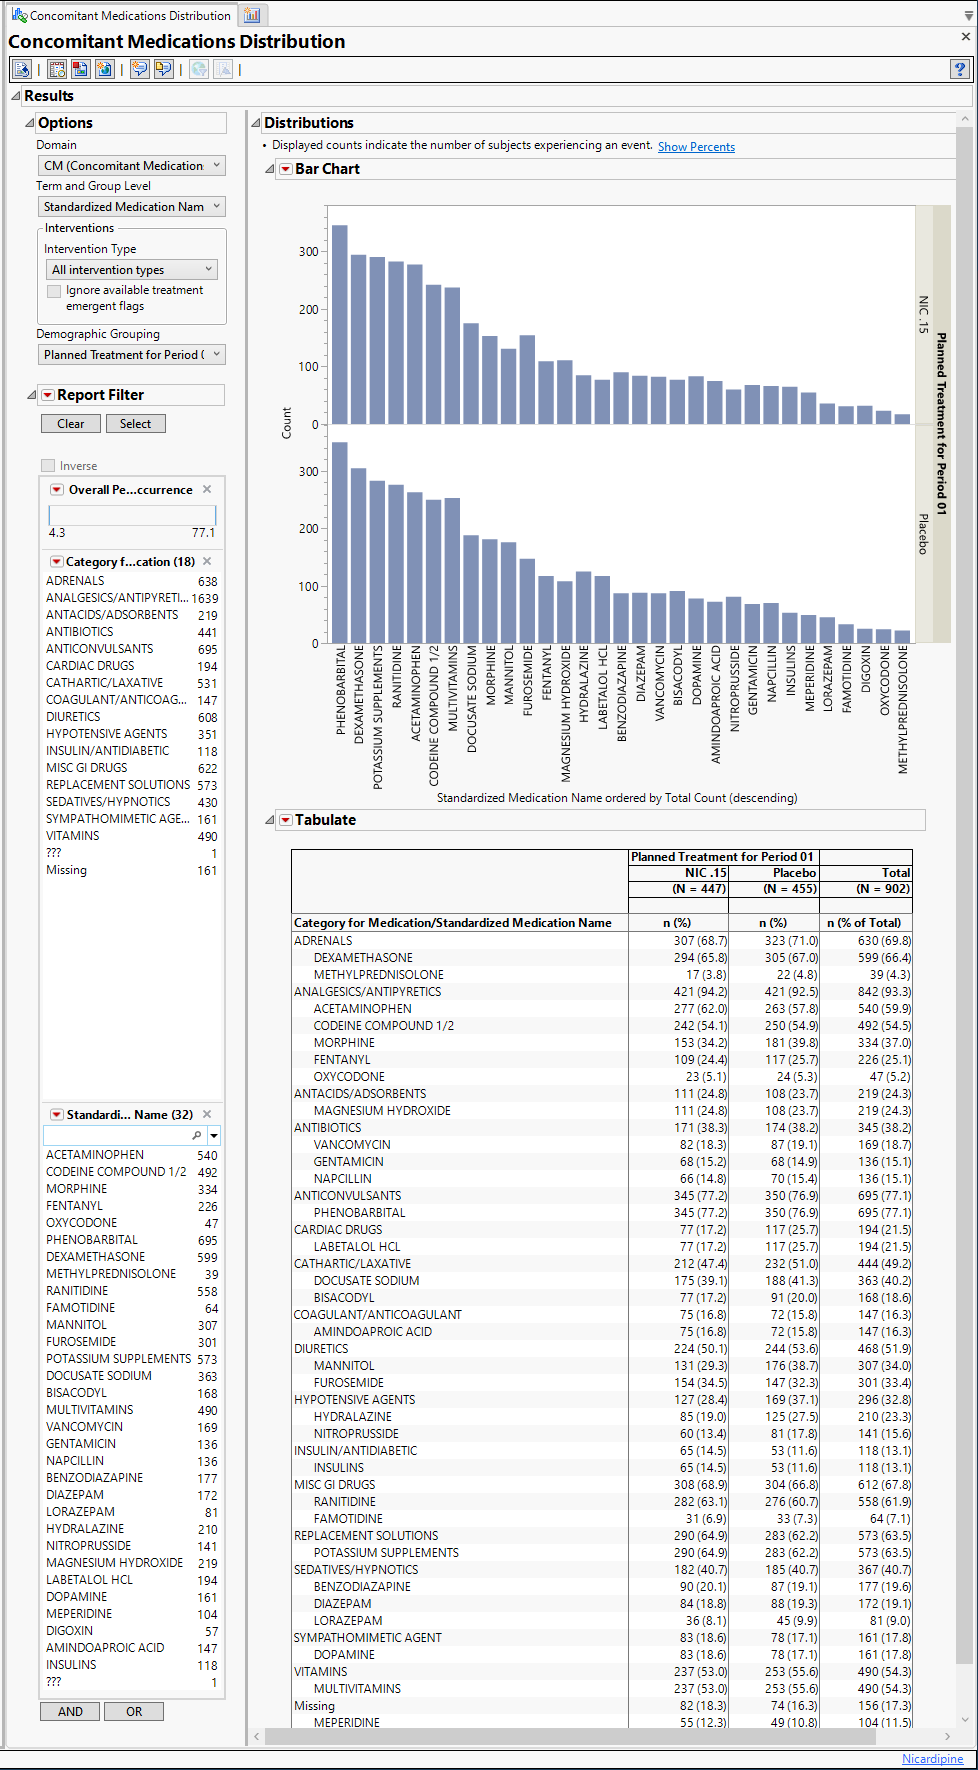
The report contains the following elements:
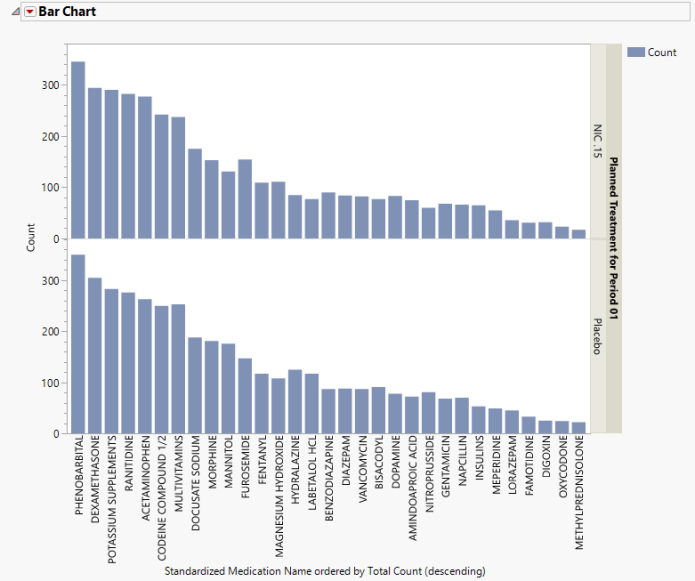
Bar Chart
Using a Bar Chart or Tree Map, this section summarizes the counts (or percentage of subjects) receiving the specified type of intervention during the course of the study. Results can be displayed either as total counts or percentages.
In the example shown here, counts of concomitant medications administered by treatment are displayed.
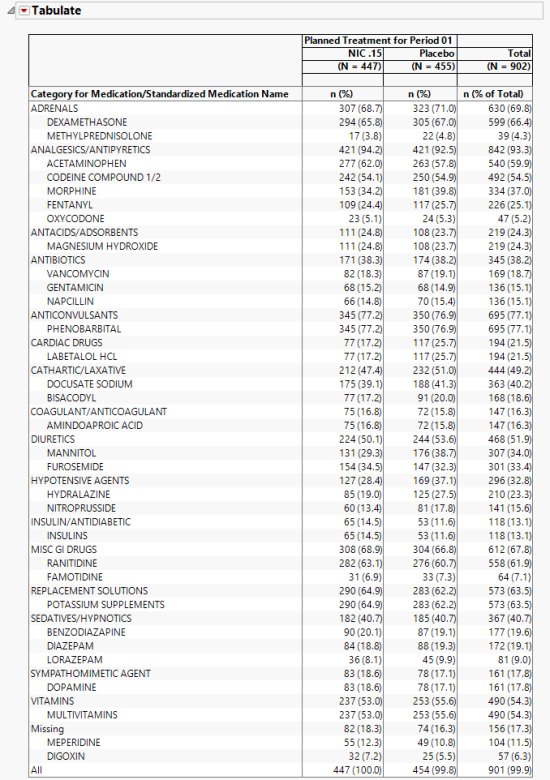
Tabulate
The Tabulate section contains one Table detailing the counts (and Percentages) for each treatment group, for each intervention within each specified term and group level. The counts, represented by n, are the number of subjects who experienced the given intervention. The All row at the bottom of the table is the number of subjects who experienced at least one intervention.
The Tabulate section contains one Table detailing the counts (and Percentages) for each treatment group, for each dictionary-derived term within each body system or organ class.
Options
Use the drop-downs on this panel to customize your analysis.
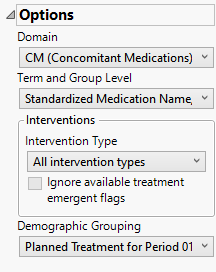
Domain
Use this widget to select the intervention domain (either Concomitant Medications or Exposure , for example)to analyze.
Term and Group Level
Term and Group Levels are determined by the coding dictionary for the Event or Intervention domain of interest, typically these levels follow the MedDRA dictionary. Use this widget to indicate how each intervention is named and the level at which the interventionis considered. The term level will determine which term is displayed on the x-axis of the bar chart. Both the term and group level will be shown in the table with term level nested within group level.
Intervention Type
Analysis can consider all interventions or only those that occur at specific times before, during, or after the trial period. For example, selecting On treatment events as the Intervention Type includes only those interventions that occur on or after the first dose of study drug and at or before the last dose of drug (+ the offset for end of dosing).
Ignore available treatment emergent flags
If you choose to Ignore available treatment emergent flags, the analysis includes all interventions made on or after day 1 of the study when the intervention type is Treatment emergent interventions.
Demographic Grouping
Results can be viewed as a whole or they can either be split out by Demographic Grouping to show different levels within each event. Demographic Grouping will change the variable displayed on the y-axis of the bar chart, as well as change the variable used across the top of the table to split the columns.
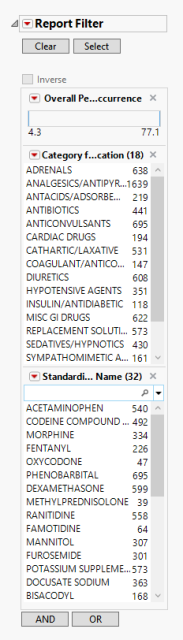
Report Data Filters
These filters enable you to subset and view subjects based on demographic characteristics and other criteria. Refer to Data Filter for more information.
Note: Filter specifications are reapplied when any widget options are changed.
General and Drill Down Buttons
Action buttons, provide you with an easy way to drill down into your data. The following action buttons are generated by this report:
| • | Click  to rerun the report using default settings. to rerun the report using default settings. |
| • | Click  to view the associated data tables. Refer to Show Tables/View Data for more information. to view the associated data tables. Refer to Show Tables/View Data for more information. |
| • | Click  to generate a standardized pdf- or rtf-formatted report containing the plots and charts of selected sections. to generate a standardized pdf- or rtf-formatted report containing the plots and charts of selected sections. |
| • | Click  to generate a JMP Live report. Refer to Create Live Report for more information. to generate a JMP Live report. Refer to Create Live Report for more information. |
| • | Click  to take notes, and store them in a central location. Refer to Add Notes for more information. to take notes, and store them in a central location. Refer to Add Notes for more information. |
| • | Click  to read user-generated notes. Refer to View Notes for more information. to read user-generated notes. Refer to View Notes for more information. |
| • | Click  to open and view the Subject Explorer/Review Subject Filter. to open and view the Subject Explorer/Review Subject Filter. |
| • | Click  to specify Derived Population Flags that enable you to divided the subject population into two distinct groups based on whether they meet very specific criteria. to specify Derived Population Flags that enable you to divided the subject population into two distinct groups based on whether they meet very specific criteria. |
Note: For information about how treatment emergent adverse events (TEAEs) are defined in JMP Clinical, please refer to How does JMP Clinical determine whether an Event Is a Treatment Emergent Adverse Event?.
Default Settings
Refer to Set Study Preferences for default Subject Level settings.
Methodology
No testing is performed. Analysis is restricted to tabulating counts/percentages of subjects experiencing interventions. The unique record to display for each intervention is determined by sorting the data by Unique Subject Identifier (USUBJID), the group level, the term level, and the day the intervention started and picking the first record for each term level.