Outliers
This report identifies outliers and sites with excessive (or too few) outliers.
Note: JMP Clinical uses a special protocol for data including non-unique Findings test names. Refer to How does JMP Clinical handle non-unique Findings test names? for more information.
Report Results Description
Running this report with the Nicardipine sample setting generates the report shown below.
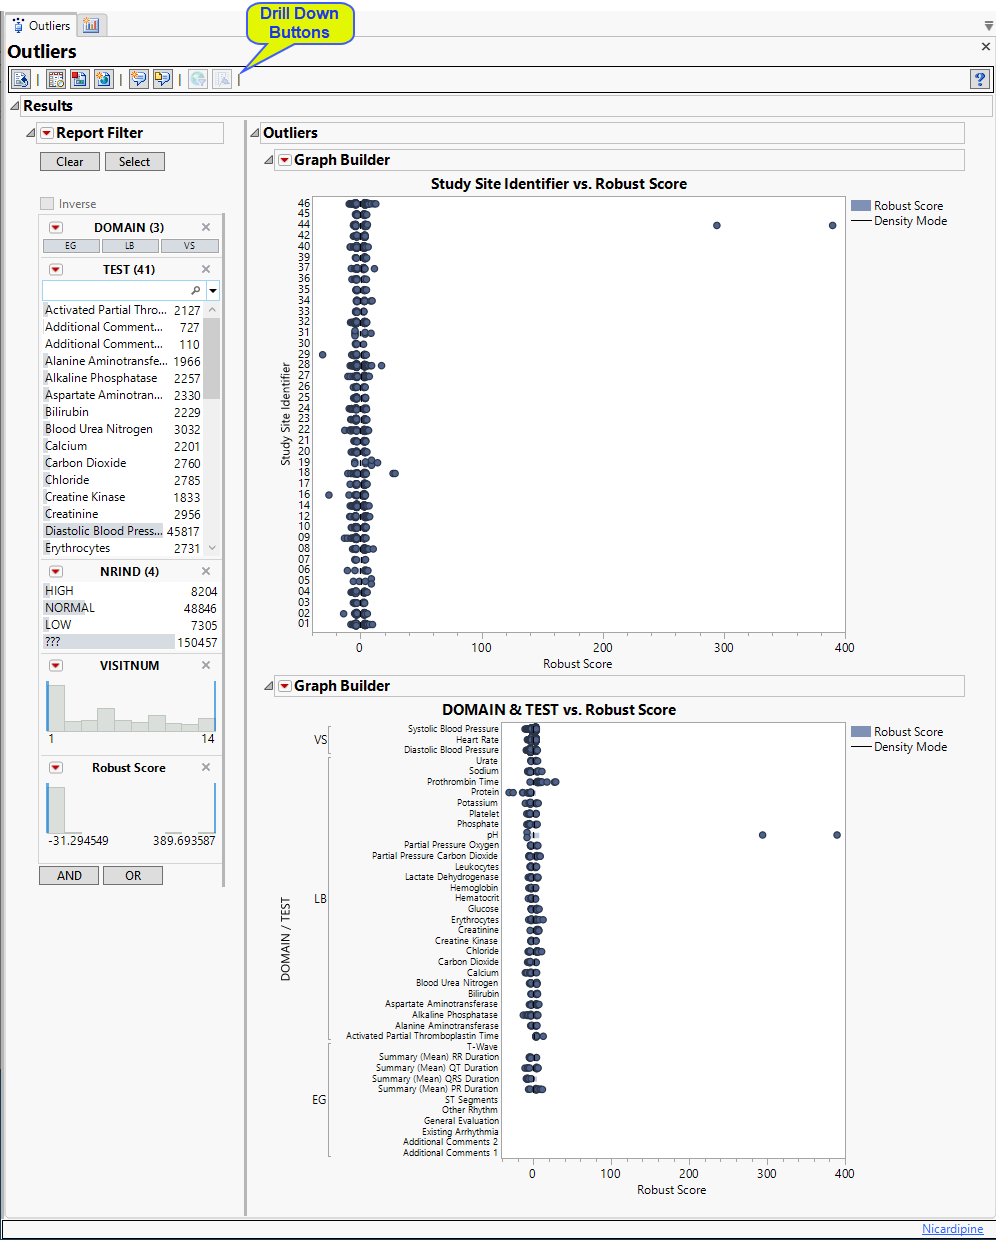
In both graphs, the robust scores (Rousseeuw and Hubert, 20111) for each finding for each patient are plotted for either individual study sites or findings. The robust score for each finding is calculated by; subtracting the median value of all observed values for that finding from each are calculated using the following equation:
where xi is the value of a finding, median(xi) is median value for all such findings, and MAD is the median of all absolute deviations from the median. Findings with robust scores that exceed  2.5 are considered outliers.
The Report contains the following elements:
Study Site Outliers
Shows a contour plot used to determine outliers across all findings tests at each study site. Study sites are listed on the Y-axis and robust scores are plotted on the X-axis.
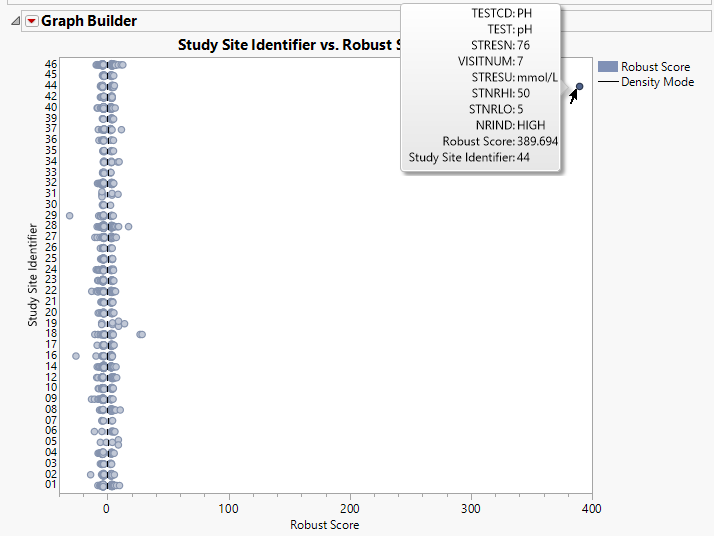
The contour plot is used to determine the deviation in the proportion of outliers at each site from the proportion of outliers at all of the other sites. The X axis represents the robust scores.
You can mouse over points of interest to see their labels (as shown above)or select points by dragging a mouse rectangle over them . Selected rows are highlighted in other plots and tables.
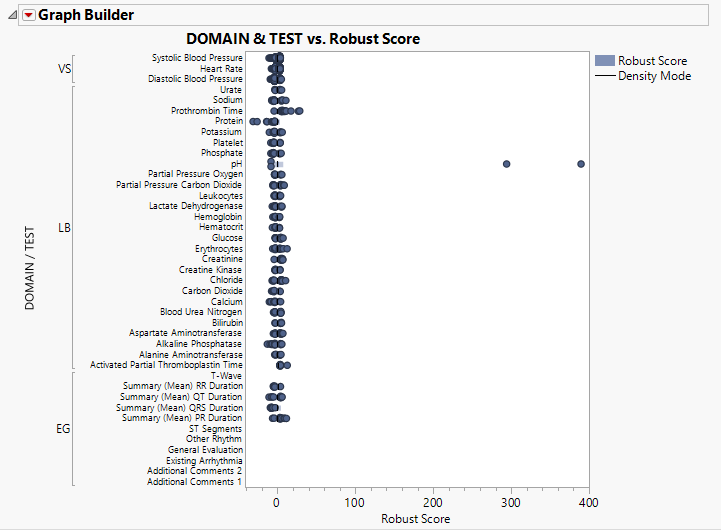
Domain/Test Outliers
Shows a contour plot used to determine outliers for each findings test across all study sites. Tests are grouped by domain. Testss are listed on the Y-axis and robust scores are plotted on the X-axis.
Report Data Filter
Enables you to filter your data and drill down to look at outliers for specific findings test results. For example, if we click on Hematocrit, we generate the following plots.
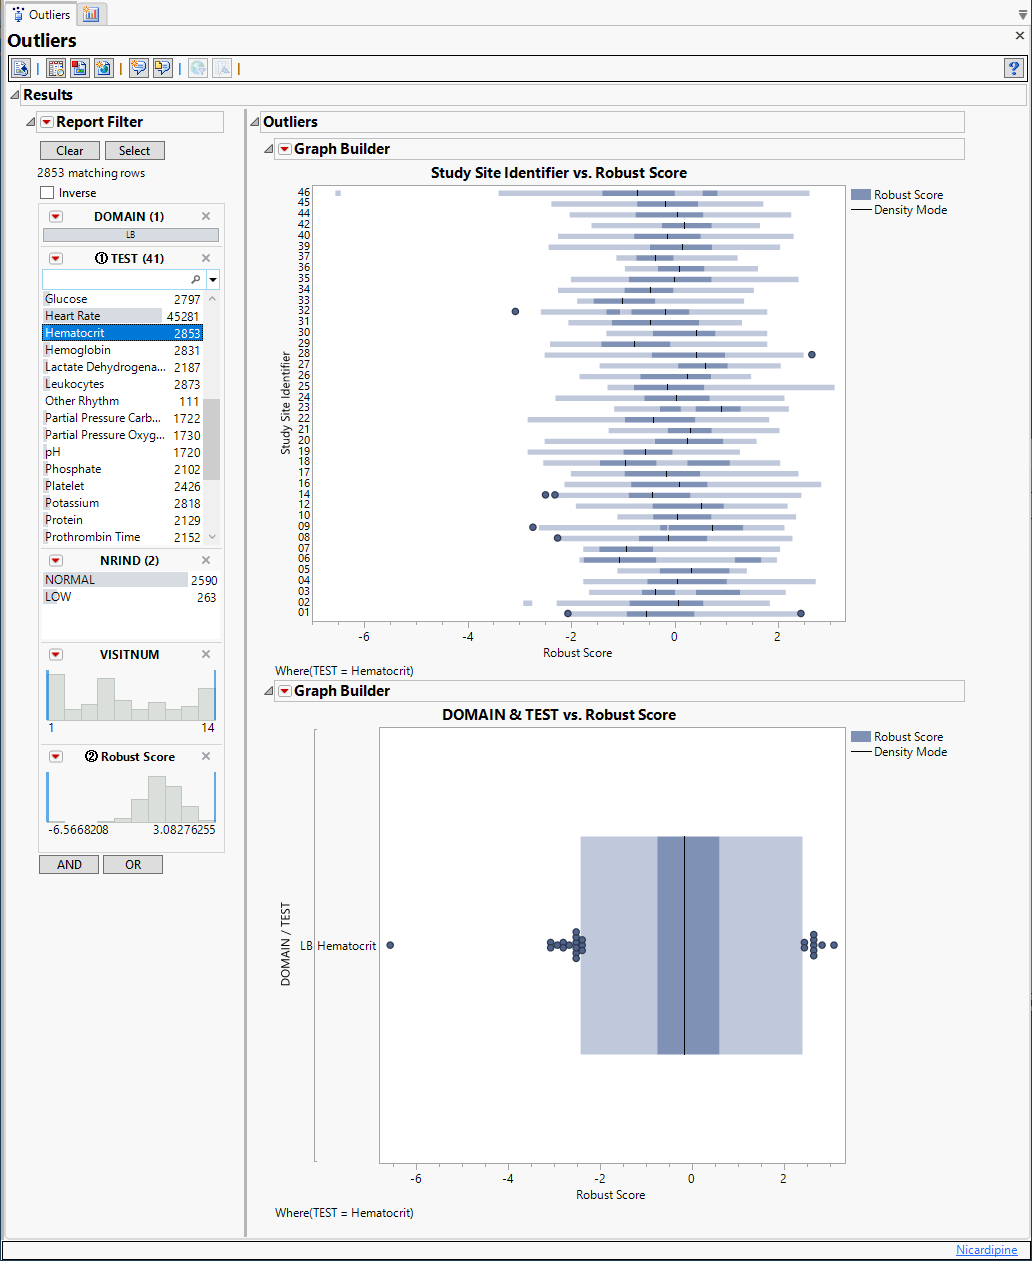
The contour plots change. They are revealed to be modified box plots. This wasn't obvious at first, when all findings for all at all visits at all study sites were plotted. Also, the scale on the X-axis is much reduced here because the extent of the outliers in this test is so much less.
General and Drill Down Buttons
Action buttons, provide you with an easy way to drill down into your data. The following action buttons are generated by this report:
| • | Click  to rerun the report using default settings. to rerun the report using default settings. |
| • | Click  to view the associated data tables. Refer to Show Tables/View Data for more information. to view the associated data tables. Refer to Show Tables/View Data for more information. |
| • | Click  to generate a standardized pdf- or rtf-formatted report containing the plots and charts of selected sections. to generate a standardized pdf- or rtf-formatted report containing the plots and charts of selected sections. |
| • | Click  to generate a JMP Live report. Refer to Create Live Report for more information. to generate a JMP Live report. Refer to Create Live Report for more information. |
| • | Click  to take notes, and store them in a central location. Refer to Add Notes for more information. to take notes, and store them in a central location. Refer to Add Notes for more information. |
| • | Click  to read user-generated notes. Refer to View Notes for more information. to read user-generated notes. Refer to View Notes for more information. |
| • | Click  to open and view the Subject Explorer/Review Subject Filter. to open and view the Subject Explorer/Review Subject Filter. |
| • | Click  to specify Derived Population Flags that enable you to divided the subject population into two distinct groups based on whether they meet very specific criteria. to specify Derived Population Flags that enable you to divided the subject population into two distinct groups based on whether they meet very specific criteria. |
Default Settings
Refer to Set Study Preferences for default Subject Level settings.
Methodology
Robust scores for all findings tests are computed as described above.