Progression Free Survival
Progression free survival is used to describe how long patients can go without the disease without getting worse. This process uses a modified survival plot and hazard ratio plot to compare the number and percentage of patients who have tumor progression or death, with patients who show no tumor progression or death at the cut-off date. Results are summarized in a set of tables.
Report Results Description
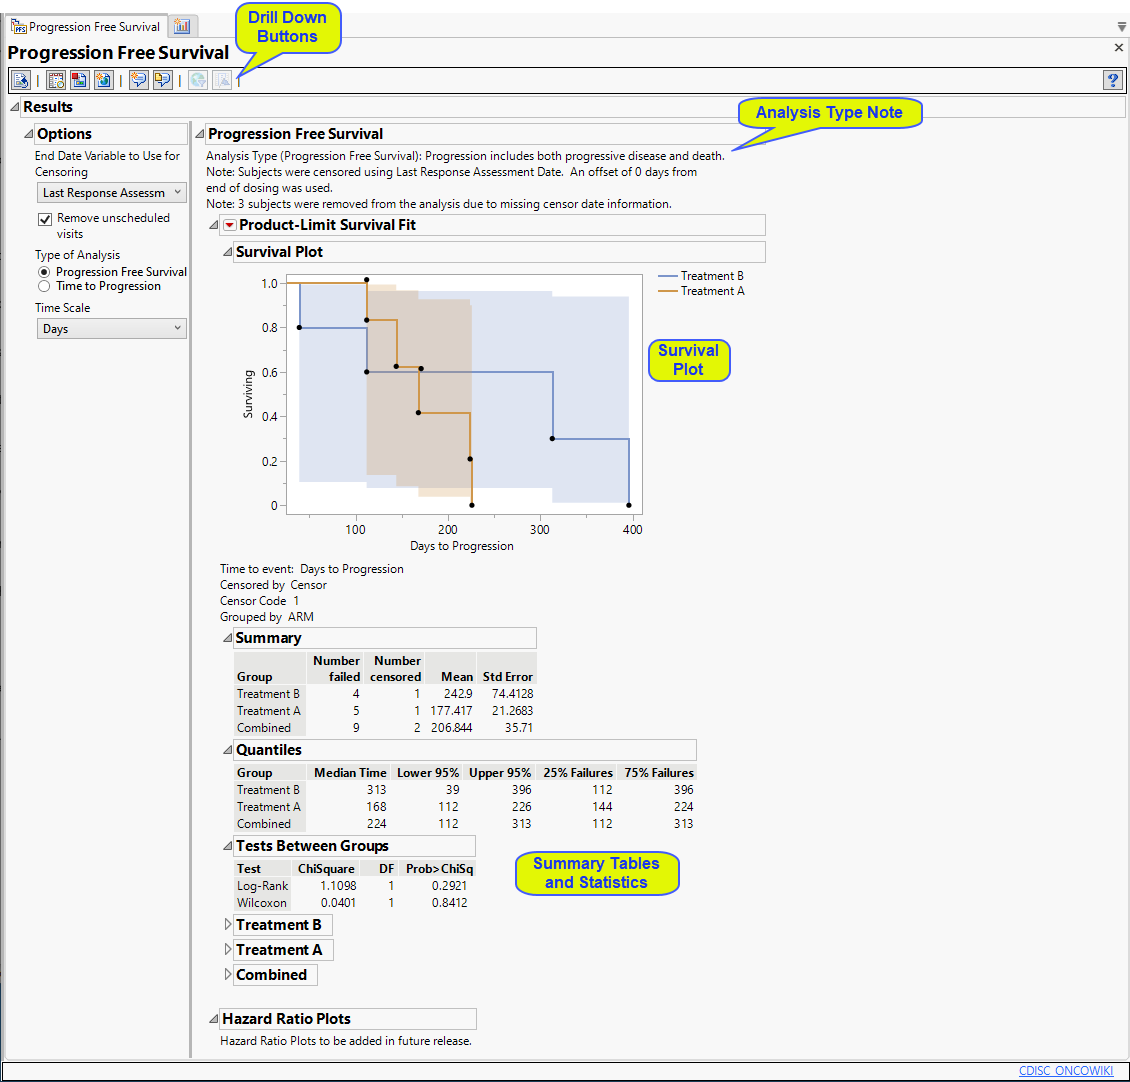
Running this report for a modified Nicardipine study using default settings generates the report shown below.
It contains the following elements:
| • | Summary text |
Summarizes the subjects plotted below.
| • | One Survival Plot |
This plot shows the probability of patients showing no disease progression over the course of the study. The plateaus indicate that the probability of not progressing remains the same during that period. The dots indicate that patients have either shown disease progression or have left the study (withdrawal or death). The connecting lines are colored by treatment.
| • | Associated Summary tables |
The tables summarize the response and statistics of patients receiving the treatment or control.
Options
End Date Variable to Use for Censoring
For patients who survive progression-free beyond the end of the study, the ultimate progression-free survival values for these individuals are unknown. All that can be said is that progression-free survival exceeds the period of the study; these data are considered censored. For these cases, you must specify the end date for collecting data to assess progression. The End Date Variable to Use for Censoring option is used to select which variable date reference from the demography domain to use for calculating the censored disease progression values. Patients who progress after this date are not considered as progressing. The Last Response Assessment Date is chosen by default.
Remove unscheduled visits
Unscheduled visits can occur for a variety of reasons. By default, these are excluded from this analysis. However, by unchecking the Remove unscheduled visits box, you have the option of including them.
Type of Analysis
The Type of Analysis widget enables you to specify whether you want to measure Progression Free Survival or Time to Progression. Progression free survival measures the time from patient randomization to either tumor progression or death. Time to progression censors death and only considers objective tumor progression. A note is added to the top of the report indication which type of analysis has been selected.
Time Scale
By default, time is measured in months. However, you can change the Time Scale to plot time in either months or weeks. This option is useful for assessing report graphics for exceptionally long studies.
General and Drill Down Buttons
Action buttons, provide you with an easy way to drill down into your data. The following action buttons are generated by this report:
| • | Click  to rerun the report using default settings. to rerun the report using default settings. |
| • | Click  to view the associated data tables. Refer to Show Tables/View Data for more information. to view the associated data tables. Refer to Show Tables/View Data for more information. |
| • | Click  to generate a standardized pdf- or rtf-formatted report containing the plots and charts of selected sections. to generate a standardized pdf- or rtf-formatted report containing the plots and charts of selected sections. |
| • | Click  to generate a JMP Live report. Refer to Create Live Report for more information. to generate a JMP Live report. Refer to Create Live Report for more information. |
| • | Click  to take notes, and store them in a central location. Refer to Add Notes for more information. to take notes, and store them in a central location. Refer to Add Notes for more information. |
| • | Click  to read user-generated notes. Refer to View Notes for more information. to read user-generated notes. Refer to View Notes for more information. |
| • | Click  to open and view the Subject Explorer/Review Subject Filter. to open and view the Subject Explorer/Review Subject Filter. |
| • | Click  to specify Derived Population Flags that enable you to divided the subject population into two distinct groups based on whether they meet very specific criteria. to specify Derived Population Flags that enable you to divided the subject population into two distinct groups based on whether they meet very specific criteria. |
Default Settings
Refer to Set Study Preferences for default Subject Level settings.
Methodology
**Need Verbiage here.