Findings Shift Tables
This report displays the shift of specified findings test results from baseline reference range to on trial reference ranges by visit grouping the subjects by treatment arm.
This report collects all of the specified findings test results and constructs a table listing the number (and percentage) of subjects when it finds a reference range indicator. Results are grouped as high, normal, or low with respect to the Baseline Reference Range indicator and the Reference Range Indicator and visit number.
Note: JMP Clinical uses a special protocol for data including non-unique Findings test names. Refer to How does JMP Clinical handle non-unique Findings test names? for more information.
Report Results Description
Running Findings Shift Tables for Nicardipine using default settings generates the report shown below.
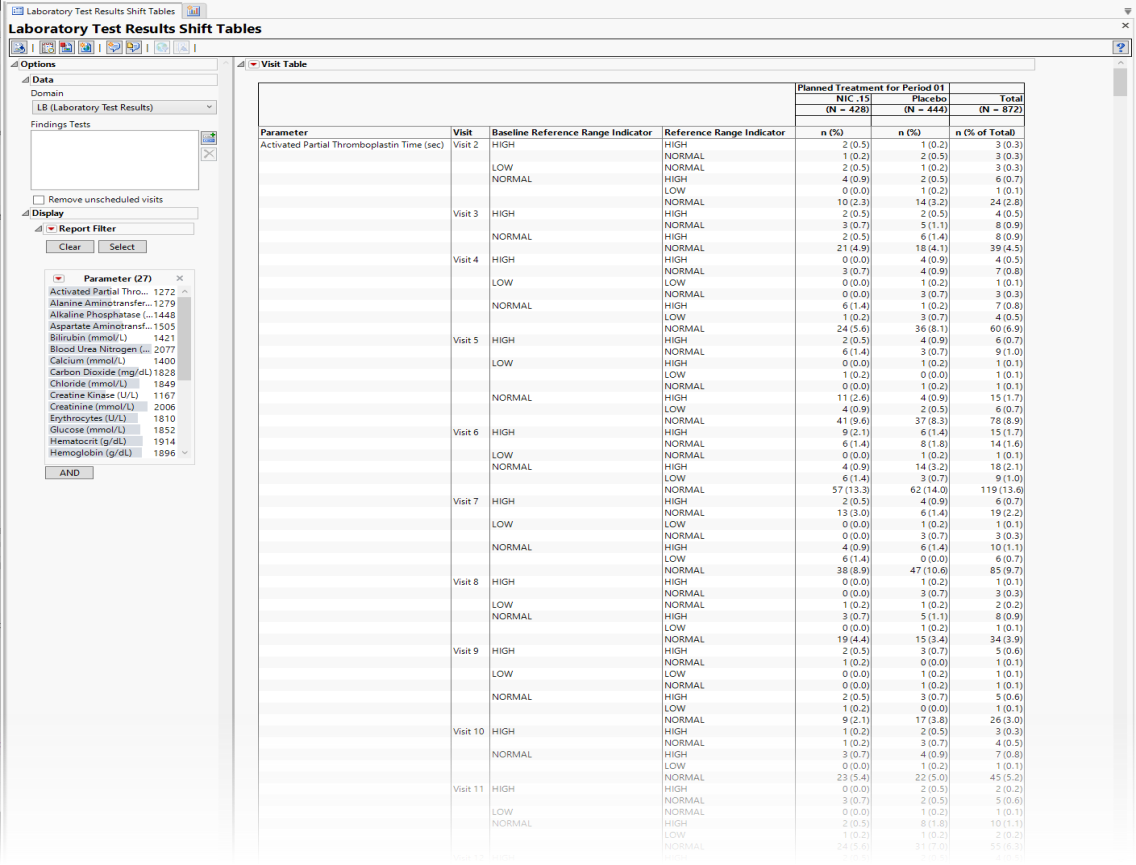
It contains the following elements:
Table
• The table lists the number (and percentage) of patients within each treatment arm whose values for each findings test fall into specific high, normal and low ranges for those tests.
Note: The reference range variables are read directly from the ADaM or SDTM data. If these variables do not exist then JMP Clinical constructs them following the rules outlined in How does JMP Clinical derive reference range and baseline reference range indicators?
Note: Baseline values are calculated as the mean of all predose measurements with a Baseline Flag value of "Y".
Options
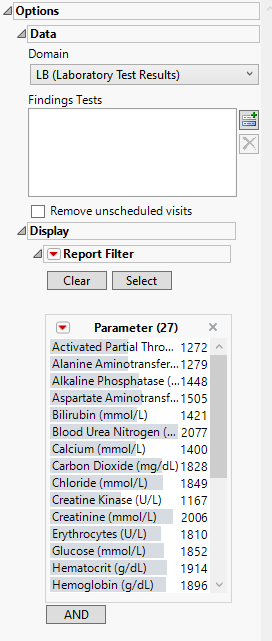
Domain
Use this widget to specify whether to plot the distribution of measurements from either the Electrocardiogram (EG), Laboratory (LB), or Vital Signs (VS) findings domains.
Findings Tests
Use this widget to select Findings Tests for the analysis. The report will autorun and analysis is restricted to the selected tests only.
Remove unscheduled visits
You might or might not want to include unscheduled visits when you are analyzing findings by visit. Check the Remove unscheduled visits to exclude unscheduled visits.
Snapshot Records to Include
Use this widget to specify which updated snapshot records to include in your analysis. This option is surfaced only in studies where the number of snapshots is greater than 0.
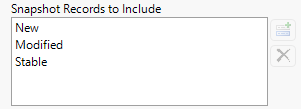
The default state of this option is to show new, modified and stable - effectively all - snapshot records. To see specific records you must remove undesired records from the analysis. For example, to surface only the new records, select both Modified and Stable and click  . Click
  to restore deleted records.
Note: JMP Clinical now relies on the JMP Compare Data Tables platform to detect new records. When duplicate rows appear, the platform evaluates them based on their row order. As a result, records are no longer labeled as Non‑Unique or Previously Non‑Unique, and the corresponding options to include those records have been removed.
Report Filter
This widget enables you to subset and view subjects based on demographic characteristics and other criteria. By default, the filter in this report enables you to filter by findings tests. Refer to Data Filter for more information on filters.
General and Drill Down Buttons
Action buttons provide you with an easy way to drill down into your data. The following action buttons are generated by this report:
| • | Click  to rerun the report using default settings. to rerun the report using default settings. |
| • | Click  to view the associated data tables. Refer to Show Tables for more information. to view the associated data tables. Refer to Show Tables for more information. |
| • | Click  to generate a standardized pdf- or rtf-formatted report containing the plots and charts of selected sections. to generate a standardized pdf- or rtf-formatted report containing the plots and charts of selected sections. |
| • | Click  to generate a JMP Live report. Refer to Create Live Report for more information. to generate a JMP Live report. Refer to Create Live Report for more information. |
| • | Click  to take notes, and store them in a central location. Refer to Add Notes for more information. to take notes, and store them in a central location. Refer to Add Notes for more information. |
| • | Click  to read user-generated notes. Refer to View Notes for more information. to read user-generated notes. Refer to View Notes for more information. |
| • | Select one or more subjects, then click  to apply the Review Subject Filter and filter all reports in the review builder on the selected subjects. to apply the Review Subject Filter and filter all reports in the review builder on the selected subjects. |
| • | Select a group of subjects and click  to specify Derived Population Flags that enable you to distinguish the selected group of subjects from the general population based on their meeting specific criteria. to specify Derived Population Flags that enable you to distinguish the selected group of subjects from the general population based on their meeting specific criteria. |
Default Settings
Refer to Set Study Preferences for default Subject Level settings.
Methodology
No testing is performed. Analysis is restricted to reporting the numbers and percentages of patients falling into specific ranges for findings test results at each visit.