Medical Query Risk Report
This process screens Standardized Medical Query (SMQ) terms by performing Cochran-Mantel-Haenszel (CMH) tests on all 2 x 2 tables constructed from event incidence and treatment arm. Output is a two-sided plot with a dot plot showing percent occurrence and forest plot showing risk measurement. Additionally there are 4 tables for narrow queries with dictionary-derived terms , broad queries with dictionary-derived terms, broad and narrow queries, and queries by System Organ Class (SOC).
Report Results Description
Running Medical Query Risk Report for the Nicardipine study using MedDRA Version 16.0 files, the planned treatment ARM, and narrow search queries, generates the Report shown below.
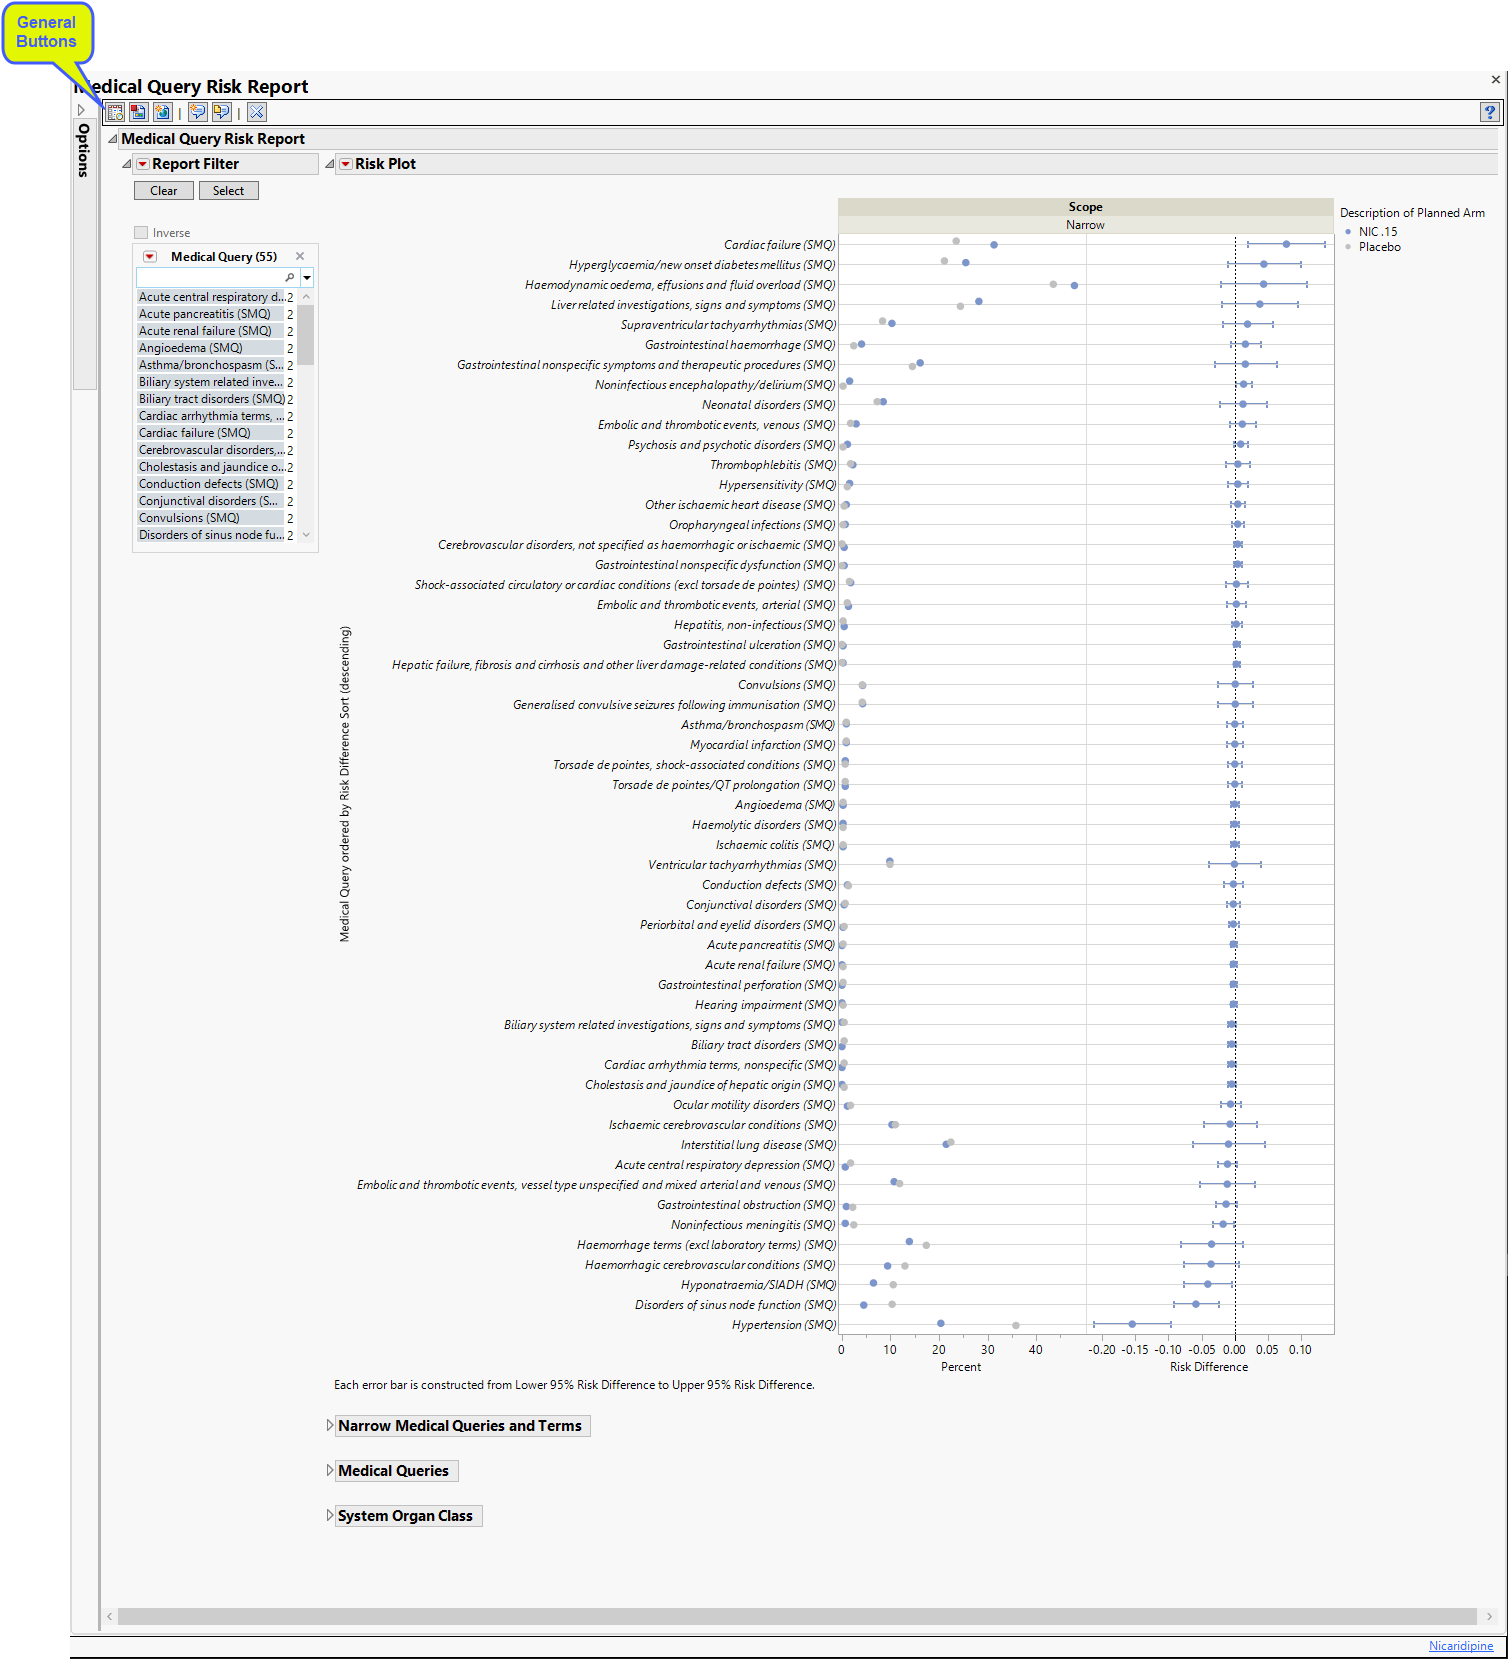
The Report contains the following elements:
Data Filter
This enables you to subset subjects based on medical queries. Refer to Data Filter for more information.
Plots
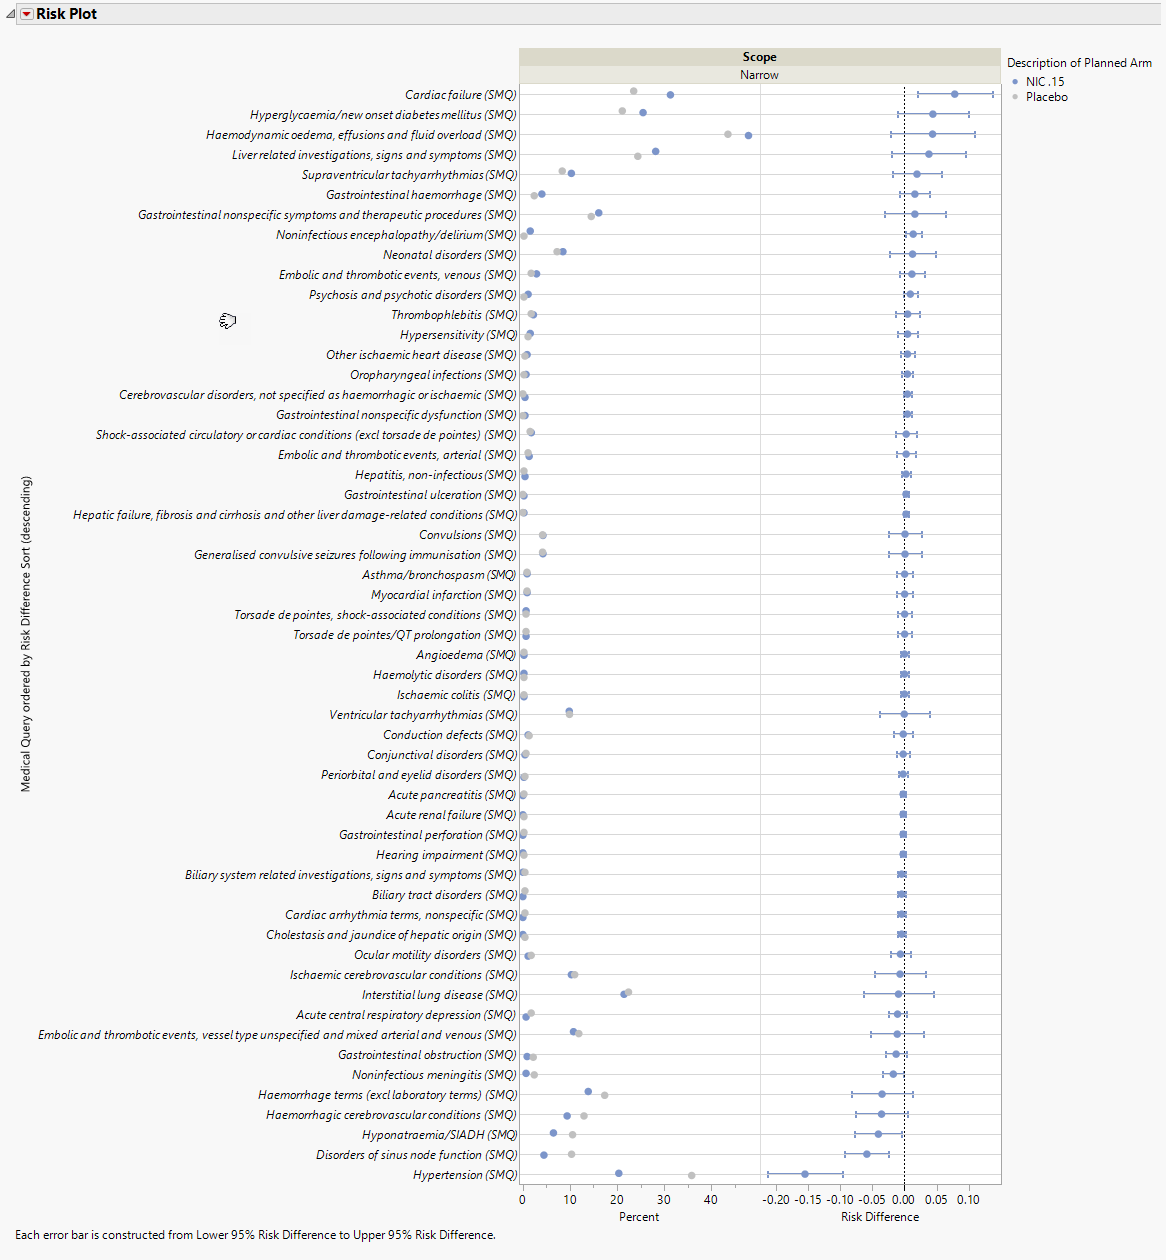
There are two plots shown here. Medical queries are shown on the y axis. The dot plot on the left shows the percentile occurrence of subjects in each arm exhibiting the queries. The Forest plot on the right shows the relative risk for subjects to exhibit events covered by each query.
Forest Plots display relative strength of treatment effects as horizontal lines representing the 95% confidence interval of the effect observed in that trial. The confidence interval is normally for the relative likelihood of a given nominal-level outcome for the intervention group compared to the control group. In this example, the forest plot shown below, represents the relative risk for developing the specified event relative to exposure to nicardipine.
Tables
Three tables were generated for this example.
Narrow Medical Queries and Terms
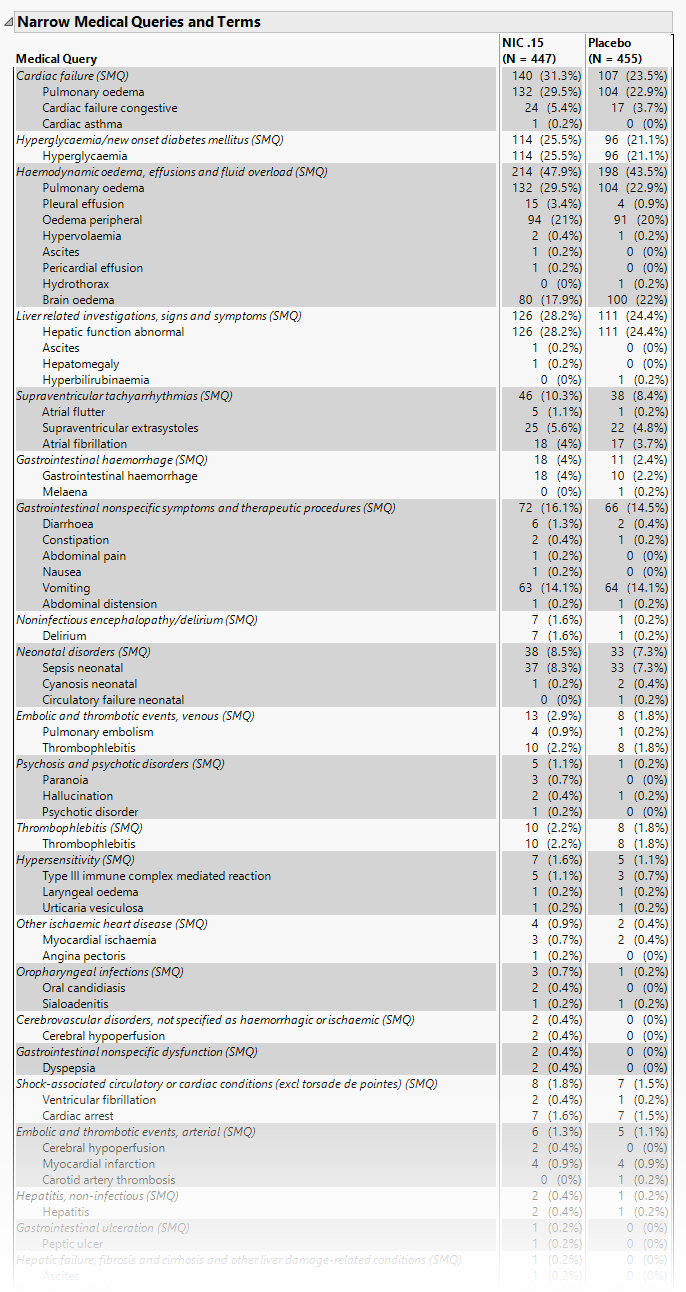
This table lists each query with its associated dictionary-derived terms, and the number (percentile) of subjects exhibiting the event.
Medical Queries
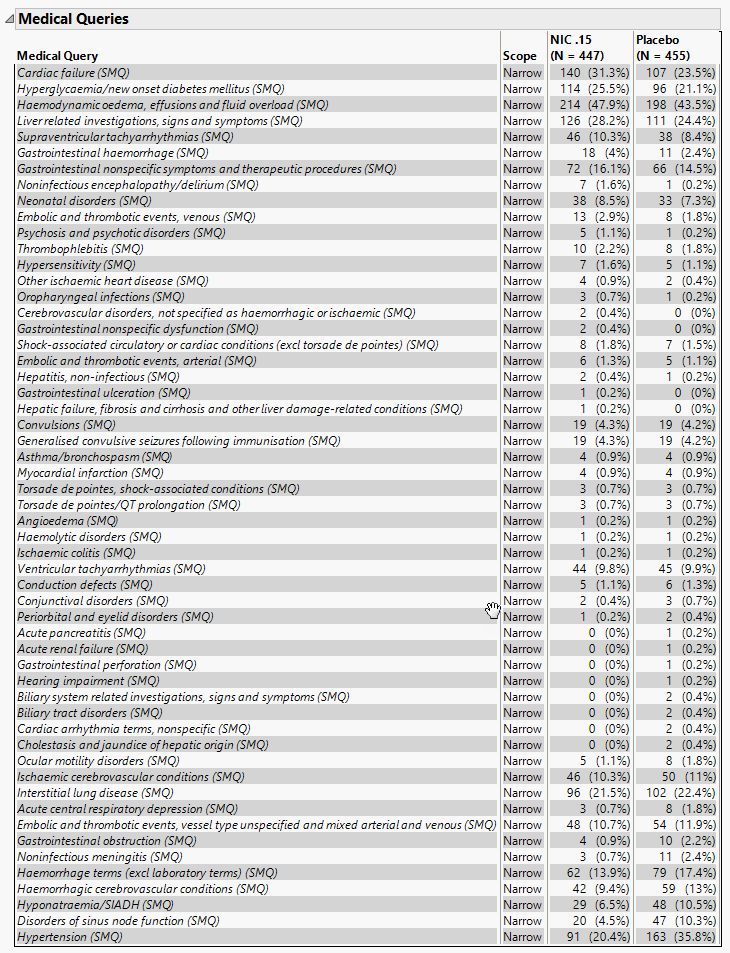
This table summarizes each query without the associated dictionary-derived terms for the number (percentile) of subjects exhibiting the event.
System Organ Class
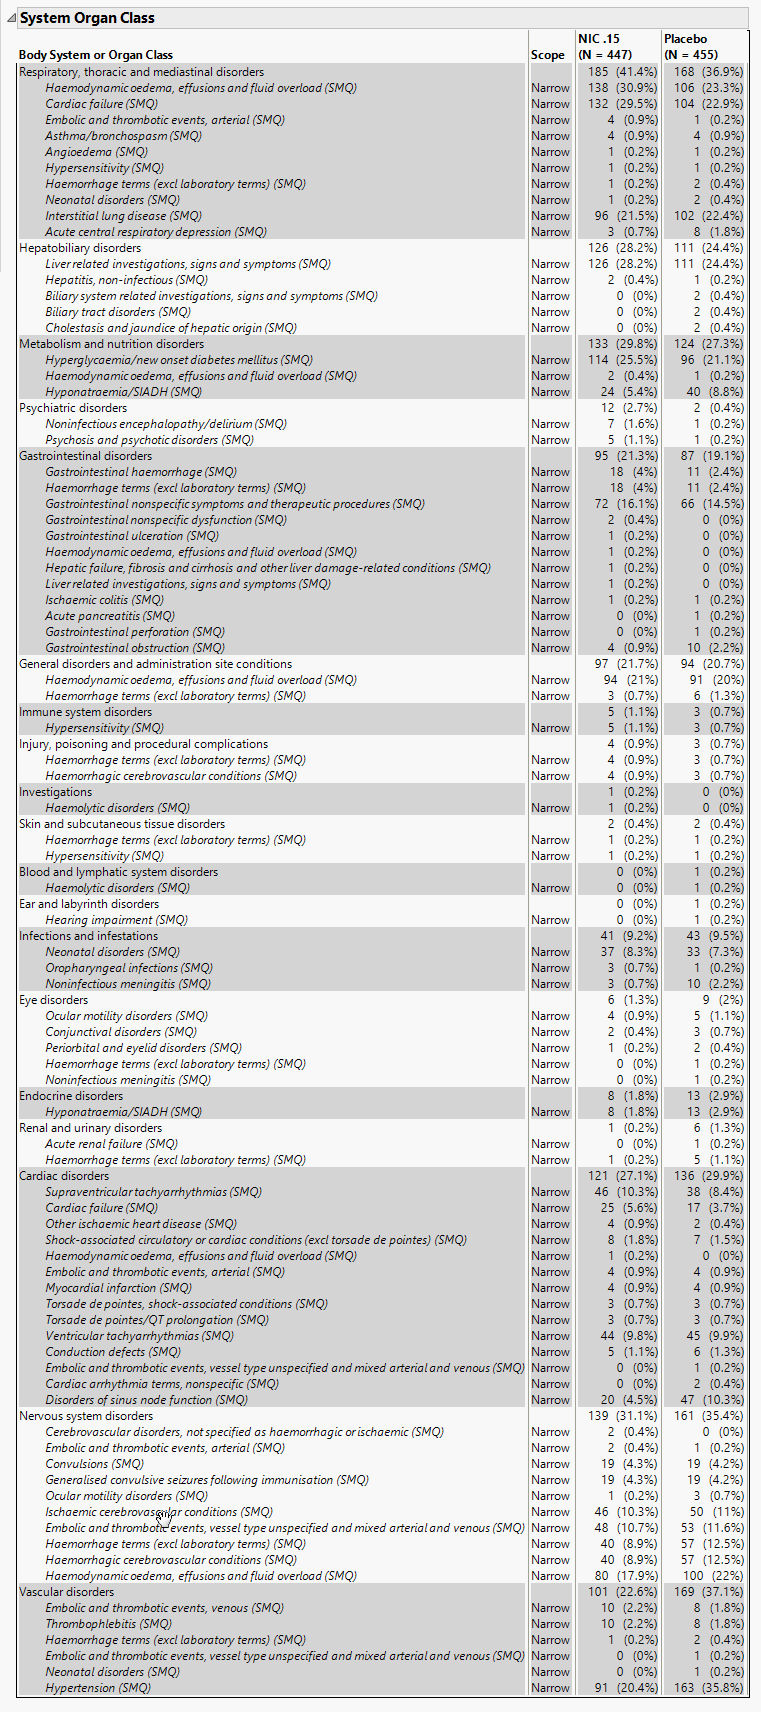
This table lists the number (percentile) of subjects exhibiting each SOC.
General
| • | Click  to view the associated data tables. Refer to View Data for more information. to view the associated data tables. Refer to View Data for more information. |
| • | Click  to generate a standardized pdf- or rtf-formatted report containing the plots and charts of selected sections. to generate a standardized pdf- or rtf-formatted report containing the plots and charts of selected sections. |
| • | Click  to generate a JMP Live report. Refer to Create Live Report for more information. to generate a JMP Live report. Refer to Create Live Report for more information. |
| • | Click  to take notes, and store them in a central location. Refer to Add Notes for more information. to take notes, and store them in a central location. Refer to Add Notes for more information. |
| • | Click  to read user-generated notes. Refer to View Notes for more information. to read user-generated notes. Refer to View Notes for more information. |
| • | Click the arrow to reopen the completed report dialog used to generate this output. |
| • | Click the gray border to the left of the Options tab to open a dynamic report navigator that lists all of the reports in the review. Refer to Report Navigator for more information. |
Report Options
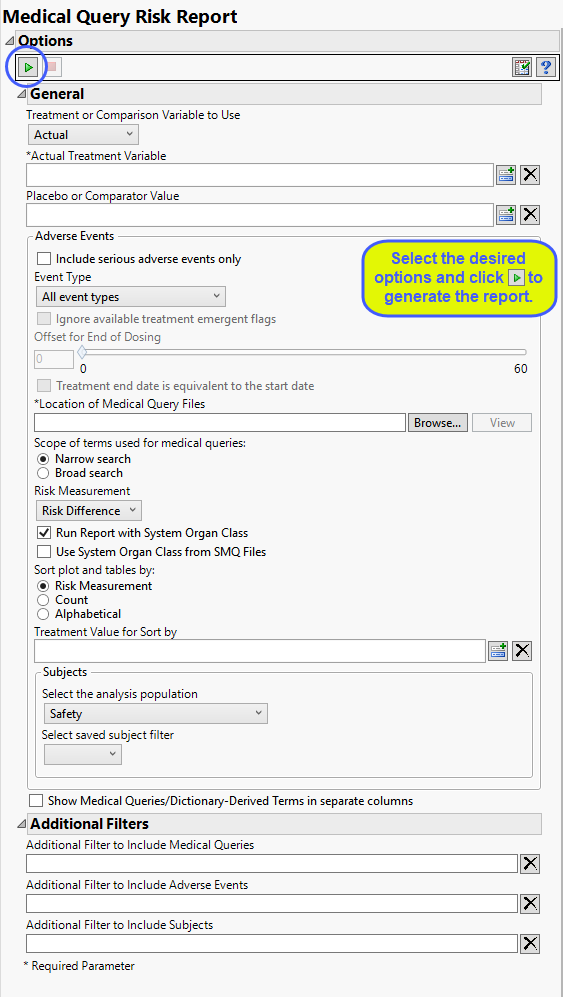
Setting Up Treatment or Comparison Variable:
Treatments are defined by specific values in the treatment or comparison variables of the CDISC models. These variables are specified in this report using the Treatment or Comparison Variable to Use, Actual/Planned/Comparison Variable, and Placebo or Comparator Variable options. Available variables include Planned, which is selected when the treatments patients received exactly match what was planned and Actual, which is selected when treatment deviates from what was planned. Alternatively, you can select Defined Below to specify a single comparison variable. The Placebo or Comparator Variable option is used for comparison to either the actual or planned treatment variables. This option is available only when either Planned or Actual is selected as the Treatment or Comparison Variable to Use.
Adverse Events
By default, all events are included in the analysis. However, you can opt to include only those considered serious. Selecting the Include serious adverse events only option restricts the analysis to those adverse events defined as Serious under FDA guidelines.
Analysis can consider all events or only those that emerge at specific times before, during, or after the trial period. For example, selecting On treatment events as the Event Type includes only those events that occur on or after the first dose of study drug and at or before the last dose of drug (+ the offset for end of dosing).
If you choose to Ignore available treatment emergent flags, the analysis includes all adverse events that occur on or after day 1 of the study.
By default, post-treatment monitoring begins after the patient receives the last treatment. However, you might want to specify an Offset for End of Dosing, increasing the time between the end of dosing and post-treatment monitoring for treatments having an extended half-life.
Check the Treatment end date is equivalent to the start date if the treatment end date (EXTENDTC) is missing from the data. In this case, it is assumed that all treatments were given on the same day and that the treatment start date can be used instead.
You must specify the location of the Medical Query ASCI files. See Location of Medical Query Files for more information.
The Scope of terms used for medical queries: option enables you to define the scope of the search for dictionary-derived terms to associate with the observed events. A Narrow search restricts you to only those terms that are likely to most accurately indicate the condition. A Broad search includes both narrow terms and those that are much less specific.
Use the Risk Measurement, option to specify the measure you want to use for defining risk.
Checking the Run Report with System Organ Class, will result in the inclusion of a System Organ Class table in the output. Checking the Use System Organ Class from SMQ Files option gets System Organ Class information from the SMQ tables instead of from AE.
By default, tables and plots are sorted by values of the specified Risk Measurement. Use the Sort plot and tables by:option to sort alphabetically or by count instead. You can also specify a Treatment Value for Sort by
Filtering the Data:
Filters enable you to restrict the analysis to a specific subset of subjects and events based on values within variables. You can also filter based on population flags (Safety is selected by default) within the study data. Check the box if you want to Show Medical Queries/Dictionary-Derived Terms in separate columns.
See Select the analysis population, Select saved subject filter1, Additional Filter to Include Medical Queries, Additional Filter to Include Adverse Events, Additional Filter to Include Subjects for more information.