Enrollment Patterns
This report plots observed and cumulative enrollment by site. It generates uniformly weighted moving average plots to determine whether enrollment patterns within each site appear unusual.
Report Results Description
Running this report with the Nicardipine sample setting and default options generates the output shown below.
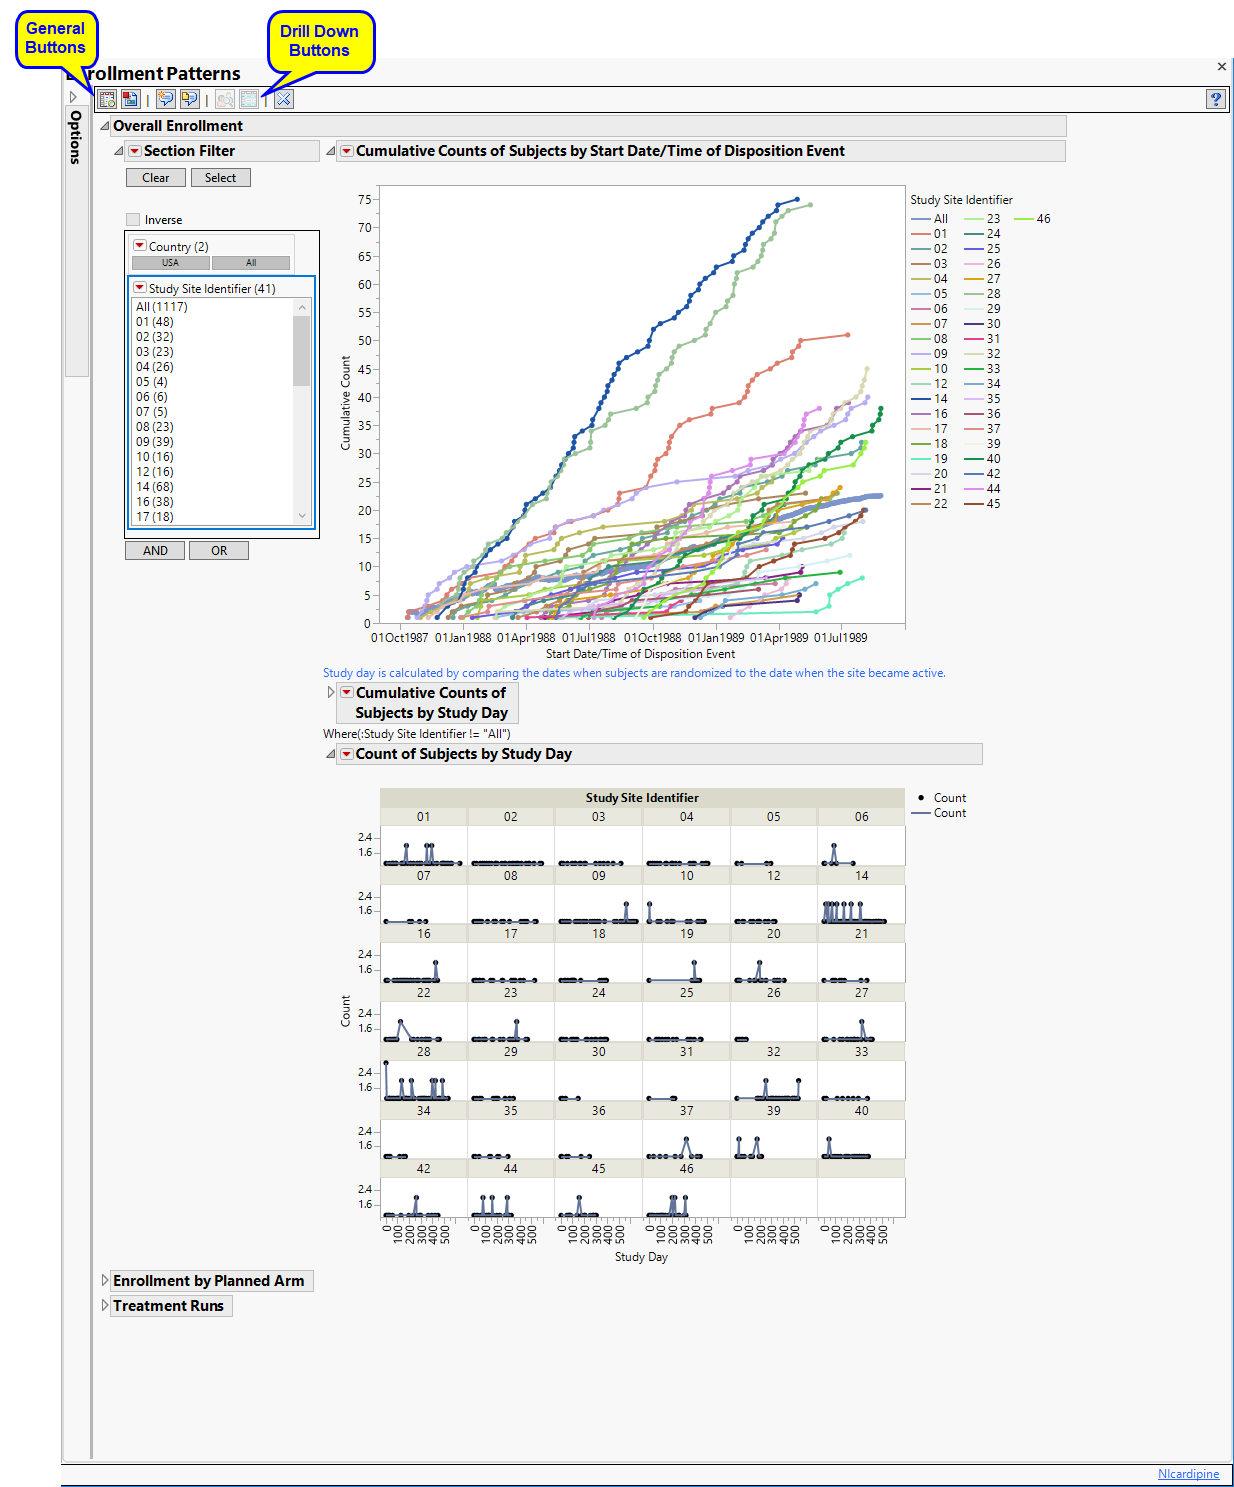
The Demographics Distribution report initially shows three sections Overall Enrollment, Enrollment by Planned/Actual Arm, and Treatment Runs. Use the available options in each section to drill-down into the data.
Overall Enrollment
Displays two graphs showing the cumulative count of subjects randomized to the trial versus the date as well as study day relative to when the site became active. A plot of counts across study days (relative to site) displays the number of subjects that enroll on any given day.
The Overall Enrollment section contains the following:
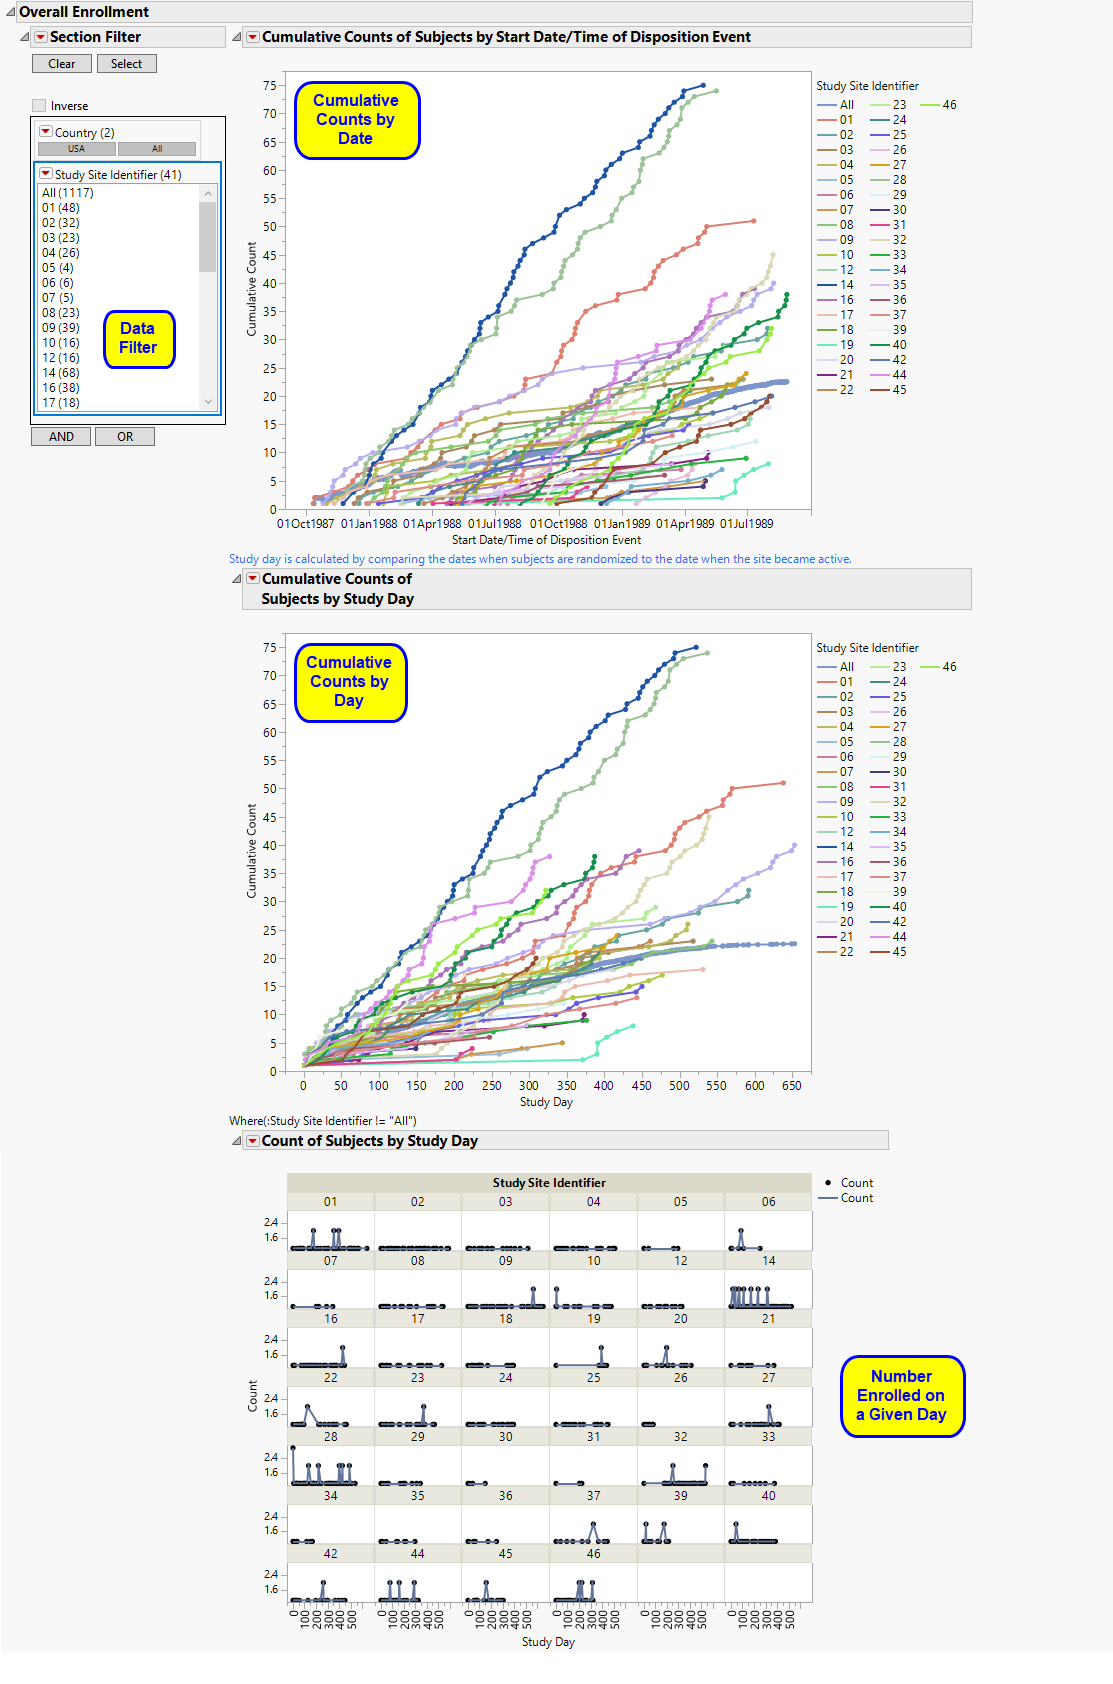
| • | Data Filter: Enables you to filter data based on study site and country. |
| • | The first graph is a cumulative count of subjects randomized to the trial versus the date of enrollment. Each line represents the cumulative counts for a specific site. All represents the rolling average of cumulative counts across all sites, based on the number of sites in the trial on the specific date. Note: The information used to get the randomization dates for this graph comes from DSSTDTC (assuming DS) exists . Otherwise, the software looks for RANDDT next and then RFSTDTC/TRTSDT. |
| • | The second graph is a cumulative count of subjects randomized to the trial versus study day computed relative to when the study site became active. In this case, the date on which the site becomes active is adjusted to Day 1. All represents the average of cumulative counts across all sites, based on the total number of sites in the trial. |
Note: The second graph is the study day of randomization whereas the first graph is supposed to be showing the date of randomization. Both graphs are supposed to be basing the date/study day off of date of randomization whether that's from DS, RANDDT, or RFSTDTC/TRTSDT.
| • | The plots of counts across study days also show major deviations in terms of the number of subjects that enroll on any given date. prints days only when subjects were enrolled. Note: All is not printed, since this would be printing an average of all sites on the respective day. |
Sites showing an unusual change in cumulative counts on or about a specific day should be investigated further, although this could identify sites that tend to block enroll patients on scheduled days.
Enrollment by Planned/Actual Arm
Displays plots of the cumulative enrollment across time by either planned or actual treatment arm by study site.
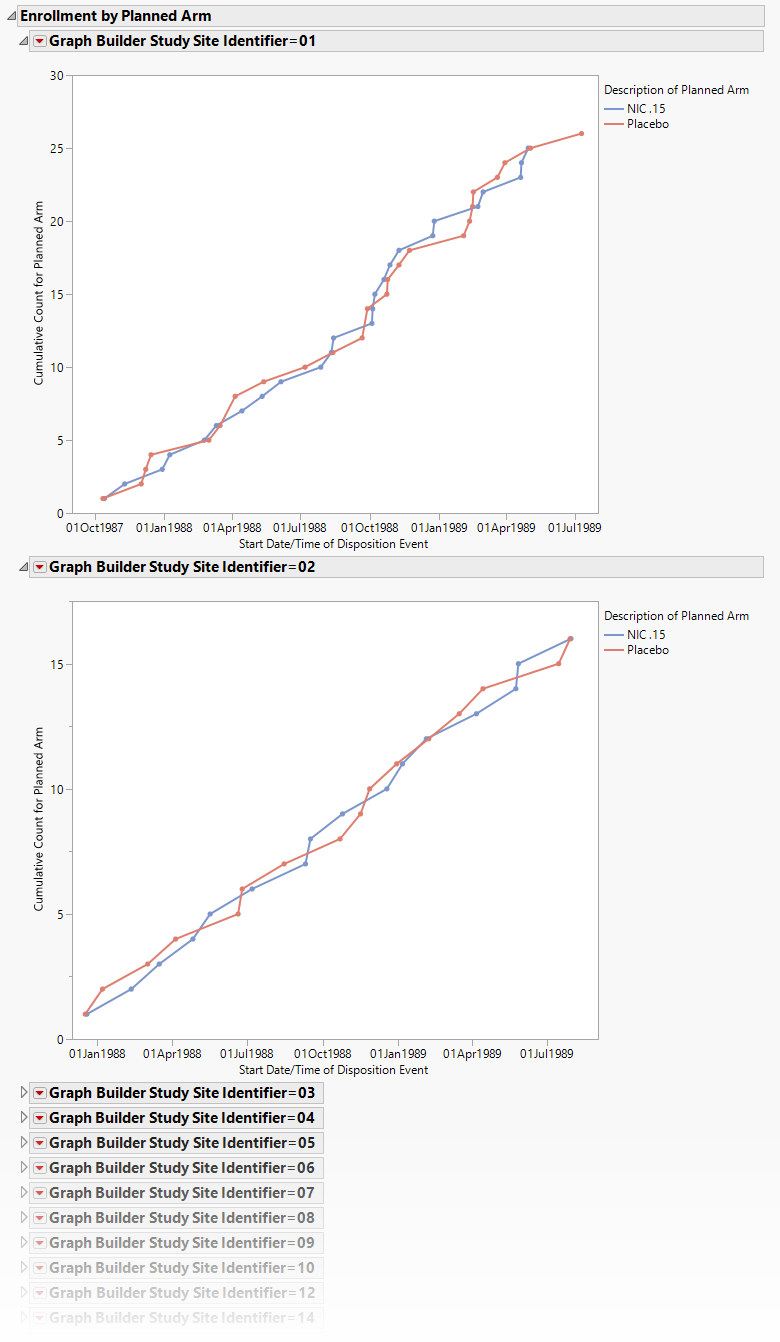
Displays one plot for each study site showing the cumulative enrollment across time by either planned or actual treatment arm.
Treatment Runs
Displays histograms showing distribution of subjects across study sites, treatment arms, and run counts, which is the number of times a treatment was dispensed in a row within a site. Knowledge of the randomization plan can identify run counts that are not possible in practice.
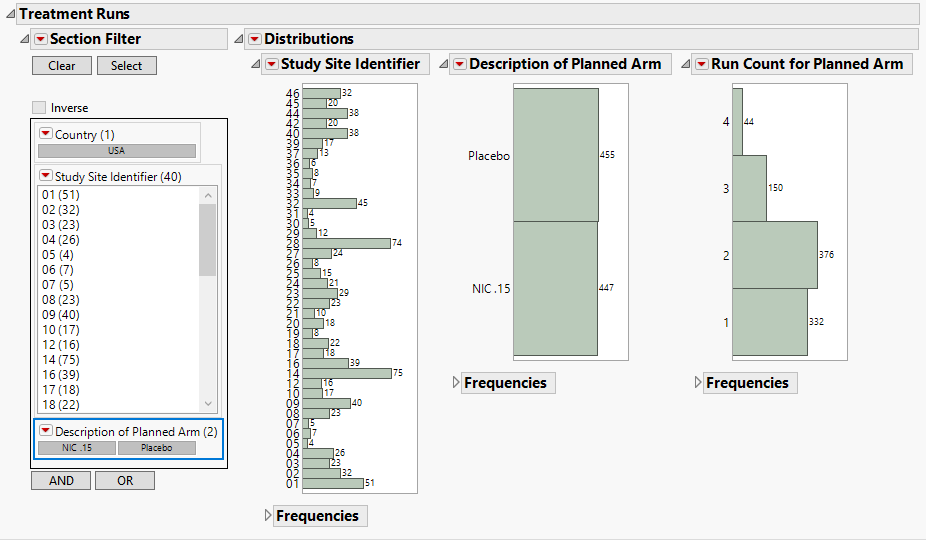
This section contains the following elements.
| • | Data Filter: Enables you to filter data based on study site and country. |
| • | Distributions: Displays histograms showing distribution of subjects across study sites, treatment arms, and run counts. Run IDs are determined, based on randomization date and usubjid, and counts are determined by the number of instances where a treatment is dispensed in a row within a site. |
This is useful to determine whether randomization errors or fraud has occurred. For example, if randomization is done with a block size of 4 and equal allocation (as selected above), the most you would ever expect to see treatment A or B occur is 4 times in a row. If a treatment is dispensed 5 times in a row, this occurrence would likely require some explanation by the investigators.
Action Buttons
Action buttons, provide you with an easy way to drill down into your data. The following action buttons are generated by this report:
| • | Profile Subjects: Select subjects and click  to generate the patient profiles. See Profile Subjects for additional information. to generate the patient profiles. See Profile Subjects for additional information. |
| • | Show Enrollment: Select one or more sites and click  to generate a subset table containing summary statistics and enrollment counts for the selected sites. to generate a subset table containing summary statistics and enrollment counts for the selected sites. |
General
| • | Click  to view the associated data tables. Refer to View Data for more information. to view the associated data tables. Refer to View Data for more information. |
| • | Click  to generate a standardized pdf- or rtf-formatted report containing the plots and charts of selected sections. to generate a standardized pdf- or rtf-formatted report containing the plots and charts of selected sections. |
| • | Click  to generate a JMP Live report. Refer to Create Live Report for more information. to generate a JMP Live report. Refer to Create Live Report for more information. |
| • | Click  to take notes, and store them in a central location. Refer to Add Notes for more information. to take notes, and store them in a central location. Refer to Add Notes for more information. |
| • | Click  to read user-generated notes. Refer to View Notes for more information. to read user-generated notes. Refer to View Notes for more information. |
| • | Click the arrow to reopen the completed report dialog used to generate this output. |
| • | Click the gray border to the left of the Options tab to open a dynamic report navigator that lists all of the reports in the review. Refer to Report Navigator for more information. |
Methodologies
No statistical tests are performed. Runs are determined by counting the number of randomized treatment values that occur in a row within a site before switching to another treatment. For example, if a site randomizes the first 4 patients to Active Treatment, Active Treatment, Active Treatment, and Placebo, the runs for Active Treatment and Placebo would be considered 3 and 1, respectively. If a site randomizes the first 4 patients to Active Treatment, Placebo, Active Treatment, and Placebo, the runs would be considered 1 for each treatment since the treatment switches every time.
Report Options
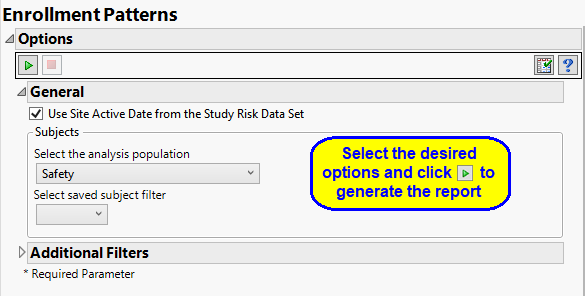
General Options
Use the Use Site Active Date from the Study Risk Data Set option to specify when the site became active.
Filtering the Data:
Filters enable you to restrict the analysis to a specific subset of subjects based on values within variables. You can also filter based on population flags (Safety is selected by default) within the study data.
See Select the analysis population, Select saved subject filter1, Additional Filter to Include Subjects, and Subset of Visits to Analyze for Findings for more information.